Climate Change, 'Greenhouse' effects: DENIAL
Message boards :
Politics :
Climate Change, 'Greenhouse' effects: DENIAL
Message board moderation
Previous · 1 . . . 25 · 26 · 27 · 28 · 29 · 30 · 31 . . . 36 · Next
| Author | Message |
|---|---|
 Bob DeWoody Bob DeWoody Send message Joined: 9 May 10 Posts: 3387 Credit: 4,182,900 RAC: 10 
|
Most likely mother nature will take the matter in hand and it won't be pretty. I think something more like AIDS but worse. Bob DeWoody My motto: Never do today what you can put off until tomorrow as it may not be required. This no longer applies in light of current events. |
 ML1 ML1 Send message Joined: 25 Nov 01 Posts: 20460 Credit: 7,508,002 RAC: 20 
|
These Asian flu strains are quite deadly. ... And there are novel as-yet-unknown ancient strains being newly released from the retreating permafrost... Some revenge-of-the-dinosaurs flu may yet be resurrected to wipe us out yet! All on our only one planet, Martin (To fill in some possibly missing pieces: The dinosaurs are the ancestors of modern day birds, and it was our mammal ancestors that likely hastened the demise of the dinosaurs by eating the dinosaur eggs and young...) See new freedom: Mageia Linux Take a look for yourself: Linux Format The Future is what We all make IT (GPLv3) |
 ML1 ML1 Send message Joined: 25 Nov 01 Posts: 20460 Credit: 7,508,002 RAC: 20 
|
Two contrasting snippets, both worrisome... Alaska's Arctic icy lakes lose thickness ... What is happening to the lakes is an example of how land ice is following the pattern of diminishing sea ice in the region, say scientists. "The decline after 2006 is quite sharp," explained Dr Cristina Surdu from the University of Waterloo, Ontario, Canada. "This is another piece ... of climate change in the region. "We're seeing warmer air temperatures; we're seeing sea-ice extent decreasing; and we're seeing a general greening of the Arctic with the treeline moving north. The lakes are part of that story." ... Emissions impossible: Did [NSA] spies sink key climate deal? ... can the world's inability to fix the problem of global warming also be laid at the spooks' door? Wind your mind back to December 2009, when world leaders converged on Copenhagen to cook up a global climate deal that would solve the problem of rising temperatures. But it appears the US already knew what everyone else was thinking. ... the NSA was ready, willing and able to provide "unique, timely and valuable" insights into the negotiating positions of the countries that attended the blockbuster summit. By monitoring "signals intelligence", the spies would keep US negotiators "as well informed as possible"... All to be trashed in the name of petty party Politics? All on our only one planet, Martin See new freedom: Mageia Linux Take a look for yourself: Linux Format The Future is what We all make IT (GPLv3) |
 The Simonator The Simonator Send message Joined: 18 Nov 04 Posts: 5700 Credit: 3,855,702 RAC: 50 
|
(To fill in some possibly missing pieces: The dinosaurs are the ancestors of modern day birds, and it was our mammal ancestors that likely hastened the demise of the dinosaurs by eating the dinosaur eggs and young...) The two aren't necessarily mutually exclusive. Life on earth is the global equivalent of not storing things in the fridge. 
|
 ML1 ML1 Send message Joined: 25 Nov 01 Posts: 20460 Credit: 7,508,002 RAC: 20 
|
(To fill in some possibly missing pieces: The dinosaurs are the ancestors of modern day birds, and it was our mammal ancestors that likely hastened the demise of the dinosaurs by eating the dinosaur eggs and young...) And another significant factor is the rapid change of climate. Ooops, and we seem to have that now! No meteor hit needed for our present example and worldwide-experiment. All on our only one world, Martin See new freedom: Mageia Linux Take a look for yourself: Linux Format The Future is what We all make IT (GPLv3) |
|
ihenderson Send message Joined: 21 Jun 00 Posts: 50 Credit: 1,100,259 RAC: 0 
|
|
|
Nick Send message Joined: 11 Oct 11 Posts: 4344 Credit: 3,313,107 RAC: 0 
|
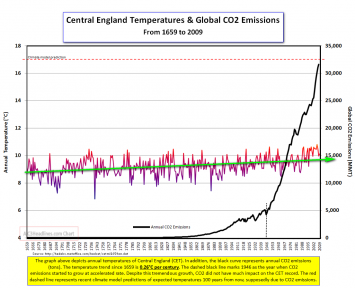
OK found this on the central England temperature data The above graph comes from the newspaper artical below, makes significant reading. http://blogs.telegraph.co.uk/news/jamesdelingpole/100022226/agw-i-refute-it-thus-central-england-temperatures-1659-to-2009/ The Kite Fliers -------------------- Kite fliers: An imaginary club of solo members, those who don't yet belong to a formal team so "fly their own kites" - as the saying goes. |
 William Rothamel William Rothamel Send message Joined: 25 Oct 06 Posts: 3756 Credit: 1,999,735 RAC: 4 
|
Nice graph. It's too small to see the labels on each axis and their units. Here in the US we have a record cold winter, Tennessee has been below freezing for several days in a row (around the clock) for three different stretches now. California's Central Valley has lost 1/4 of it's orange crop (Valencia Oranges for eating) due to freezing weather. Our Northeast has been battered by snow and ice in amounts not seen in recent decades. I wish that global warming would hurry up and get here so I won't have to move south to be able to afford my heating bills. |
|
Nick Send message Joined: 11 Oct 11 Posts: 4344 Credit: 3,313,107 RAC: 0 
|
 The Kite Fliers -------------------- Kite fliers: An imaginary club of solo members, those who don't yet belong to a formal team so "fly their own kites" - as the saying goes. |
|
ihenderson Send message Joined: 21 Jun 00 Posts: 50 Credit: 1,100,259 RAC: 0 
|
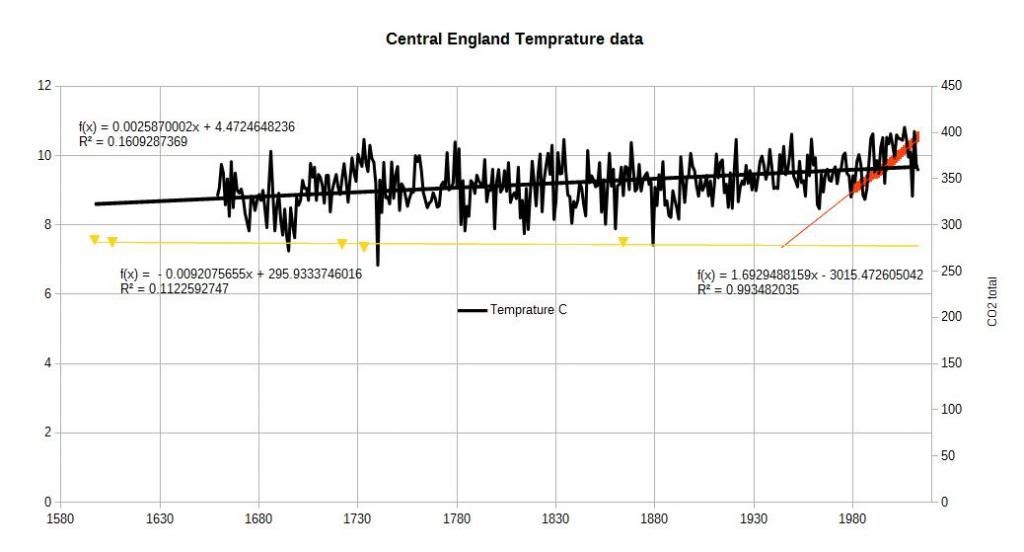
Thanks, I couldn't find the original data and the Excel work I did on this probably before 2010 since its not on my current hard drives. I think the point is yes the climate changes, and we are in a warming trend for at least 350 years. Yes man made pollution will affect the climate, but unless the climate change reaction to the CO2 increase is very delayed and slow its hard to see on real data. read the article below, up to now the climate has not moved more than in the historical data. |
 William Rothamel William Rothamel Send message Joined: 25 Oct 06 Posts: 3756 Credit: 1,999,735 RAC: 4 
|
Thank you for the new graph. A more relevant assessment would be the concentration of CO-2 in the atmosphere. To some extent the plants, seas etc can scrub and fix some of the Carbon. If we remember that there is a lot of deforestation, I wonder how the concentration in the atmosphere would look over time if it were zero. |
|
ihenderson Send message Joined: 21 Jun 00 Posts: 50 Credit: 1,100,259 RAC: 0 
|
|
 William Rothamel William Rothamel Send message Joined: 25 Oct 06 Posts: 3756 Credit: 1,999,735 RAC: 4 
|
Thats a good graph and the regression line shows vey little slope and the coefficient of determination indicates that only 16% of the variation in temperature is explained by the variation in CO-2 concentration. I presume that you just used the portion of the graph for which you had the values of the independent variable. Otherwise the numbers in the regression equation are meaningless. If you used years as the independent variable then we can conclude a small positive correlation of CO-2 concentration with the age of the Earth. Since your graph doesn't hit the Y axis anywhere near four, I suggest that there is a problem with how the regression was run. To my eye the temperature is hardly responsive to the relatively rapid run-up in CO-2 concentration. |
|
ihenderson Send message Joined: 21 Jun 00 Posts: 50 Credit: 1,100,259 RAC: 0 
|
The regression line is a linear fit only to temperature.It shows a .26 Deg C/ century slope. The CO2 was the only by yr data I could find, I have now added the CO2 numbers from Ice cores and joined them together. I don't like how the two sets of data are joined, maybe they should be separate. If you can find any better CO2 data please share.  |
|
ihenderson Send message Joined: 21 Jun 00 Posts: 50 Credit: 1,100,259 RAC: 0 
|
|
 William Rothamel William Rothamel Send message Joined: 25 Oct 06 Posts: 3756 Credit: 1,999,735 RAC: 4 
|
What happens when you regress temperature against CO-2 concentration for just the years where you have accurate CO-2 data. |
|
ihenderson Send message Joined: 21 Jun 00 Posts: 50 Credit: 1,100,259 RAC: 0 
|
That's only 30 yrs, and as you can see before the CO2 upswing there are major short term climate warming and cooling periods of 30 - 50 yrs. Don't get me wrong, yes the climate is warming, and yes I believe we are having an effect, but I think 1) CO2 dependance is over blown 2) ocean level rise will be much more than even the most pessimistic estimates from the CO2 dependent model. All that being said I will post revised graph in a few minutes. |
|
ihenderson Send message Joined: 21 Jun 00 Posts: 50 Credit: 1,100,259 RAC: 0 
|
|
|
ihenderson Send message Joined: 21 Jun 00 Posts: 50 Credit: 1,100,259 RAC: 0 
|
That's the first estimate of sea level rise I have seen of that magnitude. The slope is .02 per yr, so 40 years is .8C And as you say we have only seen a few centimeters of sea level rise so far. But my thoughts come from the graph in national Geographic I saw that show +- 50 meter changes in sea level over the last 100,000 years. Which to me means if we melt all the ice a + 50 meter rise is possible. |
 ML1 ML1 Send message Joined: 25 Nov 01 Posts: 20460 Credit: 7,508,002 RAC: 20 
|
Good to see we're into some graphs... So, to set the scene, I guess everyone is familiar with what is happening in these two examples: YouTube Vid: Heating Curve of Water -Time lapse with Graph and YouTube Vid: Doc Physics - Latent Heat of Fusion and Vaporization Now... For something the size of the ice fields and permafrost on our one dear planet... How long a temperature plateau might we expect before we notice signs of increased heating?... All on our only one planet, Martin See new freedom: Mageia Linux Take a look for yourself: Linux Format The Future is what We all make IT (GPLv3) |

©2024 University of California
SETI@home and Astropulse are funded by grants from the National Science Foundation, NASA, and donations from SETI@home volunteers. AstroPulse is funded in part by the NSF through grant AST-0307956.


