Scientific Newsletter - November 29, 2000
|
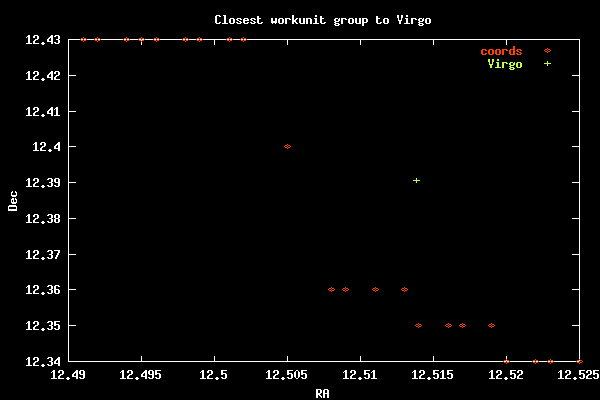
Telescope Position Testing Matt Lebofsky, Stan Corroyer In order to insure that we always know which data match which location in the sky, we need to test the telescope's positioning system. A good way to do this is by finding a strong, naturally occurring source of noise in the data. We searched the SETI@home database for Gaussians around two strong sources visible in our sky: the Crab Nebula and the Virgo cluster. Between the two, we found Gaussians closer to Virgo. Observe the following graph:

In the data we receive from Arecibo, we collect a telescope string every five seconds, which contains time and position information. A workunit lasts about 107 seconds, so within the course of a workunit we see about 21 telescope strings. The red dots above show us where the telescope was pointing every five seconds. If you connect these dots, you can see the path the telescope took during the course of the workunit. We also show the real location of the Virgo cluster which we nearly passed over during the course of this workunit.
The coordinates for the Virgo cluster are:
   RA:   12 30 49.85  (12.513847 hours)
   Dec: +12 23 26.17  (12.390603 degrees)
Our closest telescope string to Virgo contained the coordinates:
   RA:   12.513 hours
   Dec:  12.36  degrees
   RA  = Right Ascension
   Dec = Declination
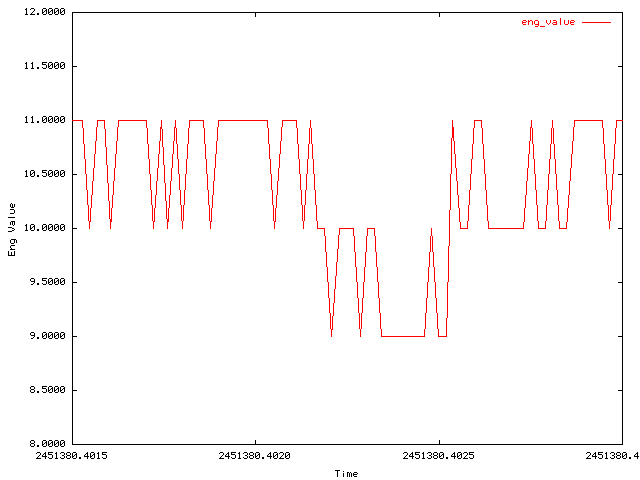
As the receiver slews past a noisy signal like this, we'd expect to see several Gaussians, which we did - 20 of them within 21 seconds, during which we were within 2 arcmin of Virgo. To reinforce these findings, we scoured through SERENDIP data taken at the same time during the above observation (which at 2451380.40240 in Julian date). Both SERENDIP and SETI@home get their data and telescope strings from the same feed, but SERENDIP data also contain "engineering values" which tell us the system stats of the SERENDIP instrument. As we pass a strong source, we expect the values pertaining to gain of the instrument to dip, since less power is needed to observe the louder signals. In fact, we do see such a dip:

Note these engineering values have integer resolution, so they have a tendency to fluctuate between two integer values. During the 130 seconds above, there are about 20 seconds where the power dips from approximately 10.5 to approximately 9.5. As well, during the exact time when the SETI@home observation was positionally closest to Virgo, the SERENDIP engineering values remained solidly near 9, showing that our gain was at its lowest nearest to the strong source. This procedure was a successful end-to-end test of all the data collection and analysis components of SETI@home and SERENDIP: We are receiving the correct time/coordinate information from Arecibo, and seeing expected signals in the right places during our back-end data analysis. We regularly do pointing tests such as this to make sure our pointing data are as accurate as possible. |

©2025 University of California
SETI@home and Astropulse are funded by grants from the National Science Foundation, NASA, and donations from SETI@home volunteers. AstroPulse is funded in part by the NSF through grant AST-0307956.