Scientific Newsletter - February 25, 2003
|
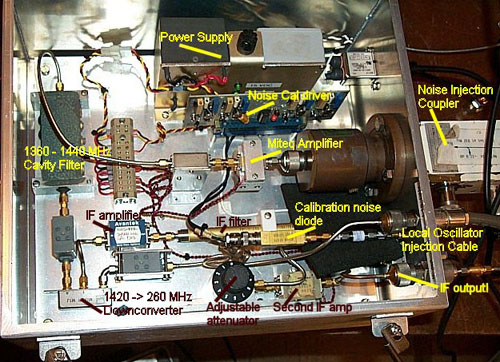
Receiver testing and maintenance Eric Person, Paul Demorest Perched atop Arecibo's radio telescope, SETI@home's receiver serves as a sensitive set of ears to listen for signs of extraterrestrial intelligence. Our current receiver was upgraded only last year, including a state-of-the-art, low-noise amplifier donated by Miteq. (See A New Receiver for SETI@home and Solving Problems at Arecibo for more details.) Below is a picture of the receiver, with labels for some of the more important components:
When lightning strikes
The most sensitive part of the receiver is the amplifier, which allows us to detect and process weak radio signals. To get maximum performance out of the instrument, we do everything we can to keep electromagnetic interference to a minimum; because of this sensitivity requirement, we are forced to leave the amplifier unprotected from large power surges or other dangers. Unfortunately, our vulnerability was exposed when a powerful thunderstorm moved through Arecibo last fall. A lightning flash typically emits 100 million to 1 billion volts of power, and one particular strike was near enough to blow out the amplifier.
Things looked grim as SETI@home became deaf to the sky. We quickly diagnosed the problem and scrambled to fix the damage. Fortunately, Miteq once again came to the rescue and donated two new amplifiers (one as a spare), both even more sophisticated than the one they replaced. The lightning occurrence highlights the importance of preparing for setbacks and scanning our systems for possible failures. Had we not been monitoring the receiver with vigilance, we may have continued to collect bad data without realizing there was a problem at all. Testing receiver performance using system temperature graphs To assure ourselves that the receiver is running properly, SETI@home checks its system temperature on a daily basis. We interpret high system temperatures as a warning; higher temperatures interfere with the receiver's ability to detect signals and can be due to either a hardware failure of some kind or interference from an external source (such as RFI). Every day we monitor system temperature by downloading and plotting chunks of sample data from Arecibo. (This data is sampled from our hydrogen survey) Below are system temperature graphs for February 2-3, 2003. The first graph (February 3) is an example of a normal day when everything is running smoothly:
Similar to other graphs from our hydrogen survey (from Newsletter 18, for example), the x-axis represents velocity relative to our solar system; negative velocities represent hydrogen moving away from us while positive velocities represent hydrogen moving toward us. The y-axis represents system temperature, which increases as noise and/or signal detections increase. We expect a hump close to a velocity of zero, because most detected hydrogen moves at slow rates relative to the solar system. The red data is from SETI@home's data recorder, while the green line represents data from the LDS hydrogen survey. (The Leiden-Dingeloo Survey (LDS), published in 1997, is the most complete hydrogen survey to date.) We compare our data with the LDS data to affirm that nothing unusual is happening. The next graph is from a day earlier (February 2, 2003). The volatile fluctuation of the red line indicates that there was a problem on this day—in this case, a radar transmission was broadcast from Arecibo, generating noise loud enough to drown out our ability to detect data:
|


©2025 University of California
SETI@home and Astropulse are funded by grants from the National Science Foundation, NASA, and donations from SETI@home volunteers. AstroPulse is funded in part by the NSF through grant AST-0307956.