Scientific Newsletter - February 14, 2003
|
The Crab Nebula: An example of telescope position testing Eric Person, Paul Demorest
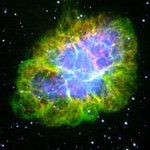
Occasionally we test the accuracy of this position data by observing known sources of noise (such as supernovas) and making sure our data correctly identifies the locations of these sources. One example of such a known source is the Crab Nebula. The Crab Nebula is the remnant of a supernova and is located in the constellation Taurus. Embedded in the nebula is a rapidly spinning pulsar that emits pulses of radiation 33 times a second. When the telescope passes over the Crab, our receiver should always receive significant interference. (The Crab Nebula image courtesy of the Palomar Observatory - click on it to enlarge). The Crab Nebula's celestial coordinates are: RA 05h 34m 32s
Dec 22º 00' 52" (J2000 coordinates)
(Note: For more information about RA and Dec, see our reference on key features of skymaps.)
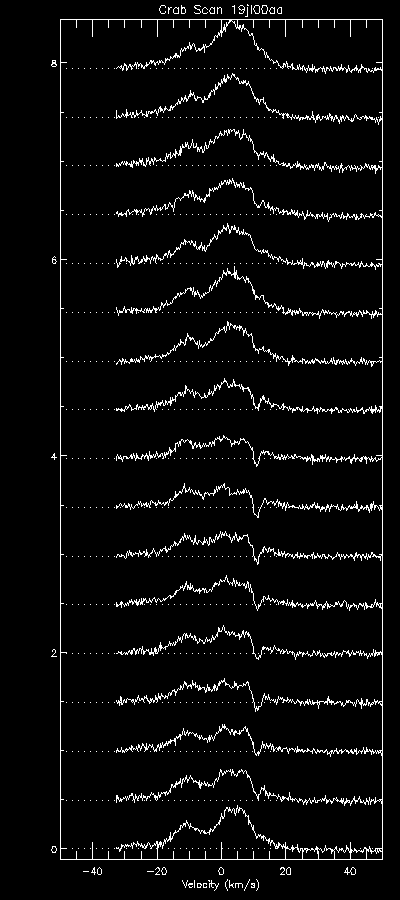
By comparing SETI@home's data at this location to the Crab Nebula's expected noise pattern, we can confirm our position records. Below are two graphs showing noise levels over time as the telescope passes over the Crab. The one on the left represents SETI@home data from March 17, 2002; the one on the right is from July 19, 2000.
An explanation of the graphs These graphs are part of a hydrogen survey currently underway at SETI@home. Each graph contains 17 vertically stacked plots—these are snapshots of the noise distribution across SETI@home's 2.5 MHz frequency band, and there are 5 seconds of elapsed time between each plot. The x-axis represents velocity relative to our solar system; negative velocities represent hydrogen moving away from us, and positive velocities represent movement toward us. The large humps appearing in the middle of each plot means that we detect more hydrogen at slower speeds relative to our solar system.
Mind the dip Now, back to the Crab Nebula. Remember that these are plots taken as the telesope passed over the Crab; the plots at the bottom of the vertical stack show hydrogen levels before hitting the Crab, and the plots at the top show levels after the telescope passed. Note that in the middle plots there is a dip that appears, just after the large middle hump. The dip occurs when the background noise is great enough to drown out hydrogen detection—interference from the Crab Nebula significantly jacks up the threshold to detect signals above noise. The influence of the Crab in this data provides concrete evidence that the data stored in SETI@home's database is accurate. SERENDIP Engineering Values The influence of the Crab Nebula can also be seen by viewing plots of data from the SERENDIP spectrometer. SERENDIP and SETI@home share the same receiver at Arecibo, but SERENDIP also collects engineering values (statistics tracking the performance of the collection system). Since less amplification is needed to measure stronger signals, we expect the total amplification of the system to dip when the telescope crosses noisy areas of the sky. The two graphs below (again from data collected on March 17, 2002 and July 19, 2000) plot volume vs. time. The volume levels are output by a AGC circuit which is trying to keep its output power constant. As we pass over the Crab, more power is coming in, so the AGC turns its "volume knob" down to compensate. We can clearly see the dip as we pass over the source on these two occasions:
Gaussian center = 0.40256358 days
Gaussian width = 30.71 seconds 
Gaussian center = 0.06263507 days |

©2025 University of California
SETI@home and Astropulse are funded by grants from the National Science Foundation, NASA, and donations from SETI@home volunteers. AstroPulse is funded in part by the NSF through grant AST-0307956.


