Scientific Newsletter - April 2, 2002
|
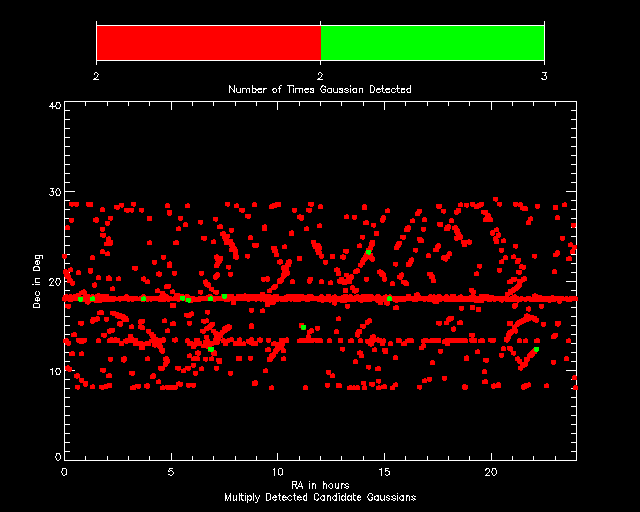
An Explanation of Signal Candidates Steve Fulton, Eric Person In Newsletter 12, we discussed some persistent Gaussians. These sets of Gaussians are considered "signal candidates". We define signal candidates as two or more events (such as Gaussians) detected in the same location of the sky at different times. Our current list of signal candidates consists only of persistent Gaussians, but in the near future our analyses will extend to spikes, pulses, and triplets. Here are 4 figures showing the distribution of our current signal candidates in the sky. (Note that for all of these figures RA (the x-axis) compressed relative to DEC (the y-axis) by a factor of 10.) Figure 1: Number of Matching Events for Each Candidate The following figure shows the number of matching events for each candidate. Currently each candidate is made up of 2 or 3 matching events; we expect more matches to accumulate as our analyses continue into the future. As of April 2, 2002, there are 2,554 candidates with 2 matching events (the red points in Figure 1) and 14 candidates with 3 matches (the green points).
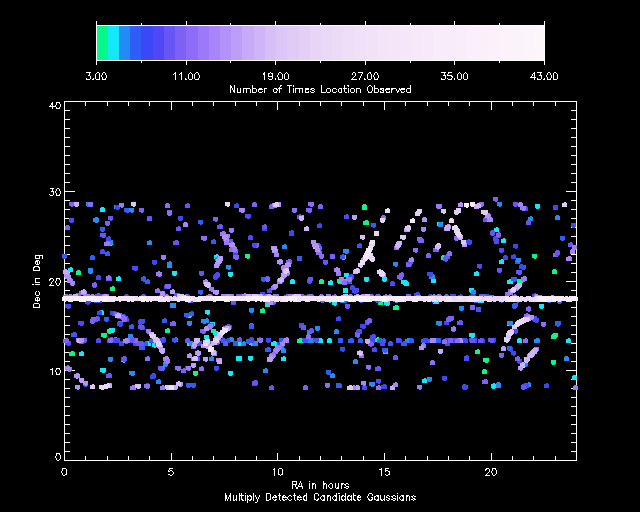
Figure 2: Number of Times Each Candidate's Sky Location Has Been Observed This figure plots signal candidates color-coded by the number of times each candidate's area of the sky (within one telescope beam) has been recorded by the SETI@home receiver. As expected, the more times a location in the sky was observed, the more likely a signal candidate (a set of persistent Gaussians) was recorded. Notice the horizontal white band on the figure at 18 degrees—these points represent the resting location of the Arecibo antenna. You will also notice a lot of arcs in the data points, representing antenna movements when the telescope tracks objects in the sky.
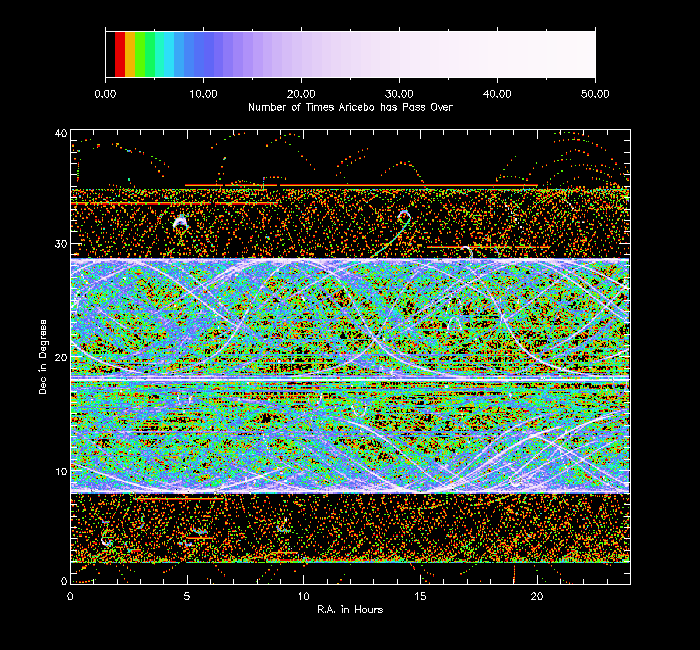
Figure 3: Sky Coverage The third figure shows the number of times the telescope has observed a given location in the sky. The bright horizontal area in the middle of the graph represents the primary observation zone of the telescope—the galaxial plane. The arcs from telescope tracings are even more visible here than in Figure 2 above.
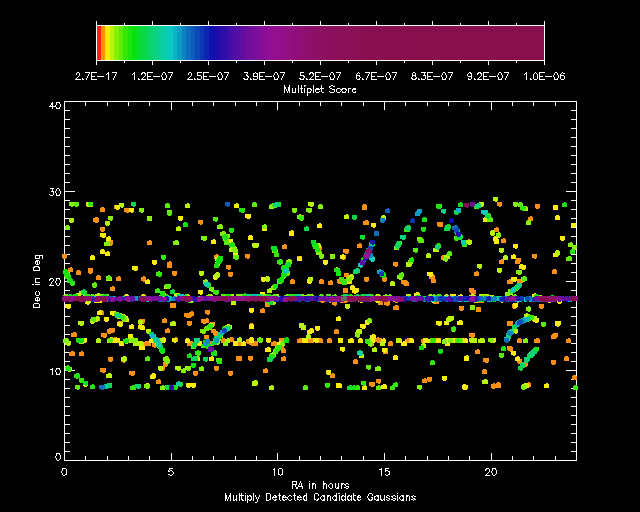
Figure 4: Distribution of Persistency Scores for Signal Candidates This final figure is the persistency score given to each group of Gaussians. The scoring system is on a scale between 0 and 1, with lower scores representing "better" detections, since the lower scores are less likely due to chance. This scoring system will be explained further in a future science newsletter. |

©2025 University of California
SETI@home and Astropulse are funded by grants from the National Science Foundation, NASA, and donations from SETI@home volunteers. AstroPulse is funded in part by the NSF through grant AST-0307956.


