| SETI@home skymaps are flat, rectangular representations of celestial space used for plotting the locations of detected radio waves. Below are descriptions of the key features visible on a typical skymap. | 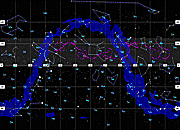
Click for a full-sized map
|
|
|
| The scanned area of the sky |
 |
The purple lines on our skymaps represent areas of the sky scanned by the Arecibo radio telescope. The line on the left is a one-day scan from August 13, 2000. If you look carefully, you'll notice that the line itself is actually composed of spikes detected on that day (with little blue and red dots marking particularly powerful spikes). |
|
|
| The celestial coordinate system (RA and Dec) |

 |
Just as latitude and longitude describe location on Earth, declination (Dec) and right ascension (RA)describe location in the celestial sphere. The north and south celestial poles and the celestial equator are analogous to Earth's poles and equator, projected into space. Declination (the y-axis of our skymaps) is measured in degrees north (positive numbers) or south (negative numbers) from the celestial equator. Right ascension (the x-axis) can also be measured in degrees but instead is commonly measured in time (hours, minutes, seconds). From an Earth-bound point of view, the sky rotates 15 degrees every hour (i.e., 360 degrees every 24 hours).
Please note that SETI@home does not release detailed candidate coordinates until
candidates have been reobserved with sufficient sensitivity to definitively confirm or reject the candidate. |
|
|
| The area of the sky measurable from Arecibo |
 |
The Arecibo telescope is stationary, detecting signals within 20 degrees of the location directly over the observatory. The grey area on our skymaps represents the area of the sky measurable from Arecibo. |
|
|
| The Milky Way Galaxy |
 |
The blue area represents the location of the Milky Way Galaxy. |
|
| Constellations |
|
|

