Intel® iGPU AP bench test run (e.g. @ J1900)
Message boards :
Number crunching :
Intel® iGPU AP bench test run (e.g. @ J1900)
Message board moderation
Previous · 1 · 2 · 3 · 4 · 5 · 6 · 7 · Next
| Author | Message |
|---|---|
 Sutaru Tsureku Sutaru Tsureku Send message Joined: 6 Apr 07 Posts: 7105 Credit: 147,663,825 RAC: 5 
|
(previously) winner from 7. run: -unroll 5 -ffa_block 1472 -ffa_block_fetch 368 -hp -tune 1 64 2 1 : Elapsed 1017.331 secs CPU 13.313 secs -unroll 5 -ffa_block 1472 -ffa_block_fetch 368 -hp -tune 1 64 2 1 : Elapsed 1019.347 secs CPU 13.781 secs -unroll 5 -ffa_block 1472 -ffa_block_fetch 368 -hp -tune 1 64 2 1 : Elapsed 1017.888 secs CPU 20.969 secs ...........................................................................................Elapsed 1018.189 secs CPU 16.021 secs (average) 11. run - test of the other -oclFFT_plan values (found new fastest params), 12. run (2nd and 3rd run of the new 3 fastest): -unroll 5 -ffa_block 1472 -ffa_block_fetch 368 -hp -tune 1 64 2 1 -oclFFT_plan 16 8 32 : Elapsed 1067.872 secs CPU 14.875 secs - 1st -unroll 5 -ffa_block 1472 -ffa_block_fetch 368 -hp -tune 1 64 2 1 -oclFFT_plan 16 8 64 : Elapsed 1058.029 secs CPU 25.453 secs - 1st -unroll 5 -ffa_block 1472 -ffa_block_fetch 368 -hp -tune 1 64 2 1 -oclFFT_plan 16 8 128 : Elapsed 1061.091 secs CPU 14.281 secs - 1st -unroll 5 -ffa_block 1472 -ffa_block_fetch 368 -hp -tune 1 64 2 1 -oclFFT_plan 16 8 256 : Elapsed 1068.990 secs CPU 15.234 secs - 1st -unroll 5 -ffa_block 1472 -ffa_block_fetch 368 -hp -tune 1 64 2 1 -oclFFT_plan 32 8 32 : Elapsed 1086.904 secs CPU 14.688 secs - 1st -unroll 5 -ffa_block 1472 -ffa_block_fetch 368 -hp -tune 1 64 2 1 -oclFFT_plan 32 8 64 : Elapsed 1008.850 secs CPU 16.750 secs - 1st -unroll 5 -ffa_block 1472 -ffa_block_fetch 368 -hp -tune 1 64 2 1 -oclFFT_plan 32 8 64 : Elapsed 994.947 secs CPU 15.984 secs - 2nd -unroll 5 -ffa_block 1472 -ffa_block_fetch 368 -hp -tune 1 64 2 1 -oclFFT_plan 32 8 64 : Elapsed 993.226 secs CPU 21.813 secs - 3rd ........................................................................................................................Elapsed 999.008 secs CPU 18.182 secs (average) -unroll 5 -ffa_block 1472 -ffa_block_fetch 368 -hp -tune 1 64 2 1 -oclFFT_plan 32 8 128 : Elapsed 1007.959 secs CPU 14.844 secs - 1st -unroll 5 -ffa_block 1472 -ffa_block_fetch 368 -hp -tune 1 64 2 1 -oclFFT_plan 32 8 128 : Elapsed 1006.604 secs CPU 16.516 secs - 2nd -unroll 5 -ffa_block 1472 -ffa_block_fetch 368 -hp -tune 1 64 2 1 -oclFFT_plan 32 8 128 : Elapsed 1006.654 secs CPU 15.328 secs - 3rd ..........................................................................................................................Elapsed 1007.072 secs CPU 15.563 secs (average) -unroll 5 -ffa_block 1472 -ffa_block_fetch 368 -hp -tune 1 64 2 1 -oclFFT_plan 32 8 256 : Elapsed 993.624 secs CPU 22.031 secs - 1st -unroll 5 -ffa_block 1472 -ffa_block_fetch 368 -hp -tune 1 64 2 1 -oclFFT_plan 32 8 256 : Elapsed 992.701 secs CPU 23.313 secs - 2nd -unroll 5 -ffa_block 1472 -ffa_block_fetch 368 -hp -tune 1 64 2 1 -oclFFT_plan 32 8 256 : Elapsed 992.907 secs CPU 22.531 secs - 3rd ..........................................................................................................................Elapsed 993.077 secs CPU 22.625 secs (average) What should I do now? Thanks. BTW. I use the fastest settings now 'live'. In the program data/slots/*/stderr.txt file I read a new AP_clFFTplan_*.bin_* file was created in the setiathome.berkeley.edu folder. Have this new file the same function like a .wisdom file (so a new calibration run in BOINC with 2 new and different tasks needed again)? 
ID: 1658231 · |
|
Josef W. Segur Send message Joined: 30 Oct 99 Posts: 4504 Credit: 1,414,761 RAC: 0 
|
Summarized:
Fastest elapsed time, but not least CPU time. That may or may not be the ideal choice given that the CPUs are nearly as fast as the GPU. You could try some testing where BOINC continues doing CPU processing while you do additional GPU bench runs. That is, just suspend GPU processing from BOINC Manager and run the bench either from a command prompt with the noBS argument or use the similar noBS setting in BenchCfg.txt. That kind of testing is more variable, of course, so multiple runs are even more important. And after the test you have to remember to resume GPU processing in BOINC> In the program data/slots/*/stderr.txt file I read a new AP_clFFTplan_*.bin_* file was created in the setiathome.berkeley.edu folder. Yes, the compiled plan binaries serve a similar purpose to FFTW's wisdom. But they're just compilations based on the -oclFFT_plan parameters, while FFTW includes automatic checking of various sets of parameters. For MB7 OpenCL and AKv8c apps, fairly thorough automatic checking is delayed to the second task simply because there are often multiple tasks being started simultaneously for the first task, and the planning doesn't work as reliably then. None of that applies to AP applications yet. Joe ID: 1658603 · |
|
Sutaru Tsureku Send message Joined: 6 Apr 07 Posts: 7105 Credit: 147,663,825 RAC: 5
|
I worry to find the fastest settings will not last days, it will last weeks/months ... ;-) With the '-unroll 5 -ffa_block 1472 -ffa_block_fetch 368' the calculation times on iGPU gone from ~21h down to ~17,5h. One CPU-thread do an AP WU in ~22h. The iGPU and CPU aren't longer similar. I could 'skip' the test run with BOINC running in the background CPU WUs? We could finish this function settings test and we go further to test the next function settings? Thanks.
ID: 1658620 · |
|
Josef W. Segur Send message Joined: 30 Oct 99 Posts: 4504 Credit: 1,414,761 RAC: 0
|
22 hours each for 4 CPU AP tasks means about 3.67 tasks per day. 17.5 hours for one GPU AP task means about 1.37 tasks per day. Put another way, the GPU may account for about 27% of your productivity now, up from about 21%. That of course assumes the 22 hour average for CPU processing hasn't increased much due to the heavier contention of faster GPU processing. Many recent AP tasks seem to end with 30/30 overflows, have 30 early repetitive pulses, or have heavy blanking so cannot be used for comparison. Many discussions here about GPUs deal with cases where one GPU is considerably faster than all the CPU cores combined, so CPU processing only accounts for a small fraction of productivity. The J1900 GPU is obviously not in that class, the GPU being about 20% faster than one CPU seems more similar than not to me. Skipping the test to see the effect of BOINC CPU processing on the GPU bench is OK, it would only characterize the interactions one direction anyhow. I suggest a quick try with -skip_ffa_precompute first, I'll be surprised if it helps. After that try -sbs 32, 64, and 128. That's just a rough check of -sbs against the default of 256 in effect for your system. For your GPU, anything between 32 and 326 is possible but the setting is an upper limit and with the other tunings I think the largest block allocation in use is much less than 256MB. Probably less than 64MB given your earlier: GPU-Z say mem usage: That really will leave only -cpu_lock and the sleep related options. They do show effects in standalone benching, but the effects while the CPUs are crunching can be expected to differ. For -cpu_lock perhaps just trying it live makes the most sense, IMO it is unlikely to hurt performance and it might give a noticeable improvement. For the sleep options, my judgement is that trying them is only indicated if the improved GPU performance has significantly slowed CPU crunching. Joe ID: 1659043 · |
|
Josef W. Segur Send message Joined: 30 Oct 99 Posts: 4504 Credit: 1,414,761 RAC: 0
|
I obviously miskeyed my calculator or made some similarly silly mistake, the "22 hours each for 4 CPU AP tasks means about 3.67 tasks per day." statement I made in my last post is wrong. 22 hours means 1.091 tasks per day for each CPU and 4.364 for the combination. Some following statements were also skewed by that mistake, but the general point I was trying to make still holds : the J1900 CPU performance is the major part of its overall performance. Joe ID: 1660079 · |
|
HAL9000 Send message Joined: 11 Sep 99 Posts: 6534 Credit: 196,805,888 RAC: 57
|
For a point of comparison my J1900 that I've been running since June. Running no GPU parameters & the CPU constantly runs at the Boost clock rate of 2.42GHz instead of 2.0GHz. I'm unsure if the GPU is running at 688MHz or 854MHz. As GPUz doesn't show clock information for it & I haven't tried any other tools thus far. I've pretty much figured the GPU as 20% of the total system output as well. I have some more precise numbers in a spreadsheet from when I tracking exactly how it preformed. It should be around here somewhere... SETI@home classic workunits: 93,865 CPU time: 863,447 hours 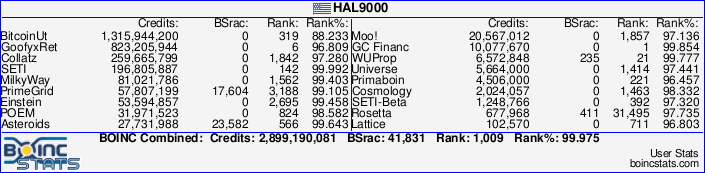 Join the [url=http://tinyurl.com/8y46zvu]BP6/VP6 User Group[ Join the [url=http://tinyurl.com/8y46zvu]BP6/VP6 User Group[
ID: 1660110 · |
|
Raistmer Send message Joined: 16 Jun 01 Posts: 6325 Credit: 106,370,077 RAC: 121 
|
Cache type: Read/Write And how that party looks for Loveland C-60 APU: Cache type: None Cache line size: 0 Cache size: 0 Global memory size: 701497344 Constant buffer size: 65536 Max number of constant args: 8 Local memory type: Scratchpad Local memory size: 32768 Kernel Preferred work group size multiple: 32 Error correction support: 0 Unified memory for Host and Device: 1 Profiling timer resolution: 1 Device endianess: Little Available: Yes maybe worth to find more recent clInfo. Or iGPU doesn't report that param at all?... ID: 1662376 · |
|
Sutaru Tsureku Send message Joined: 6 Apr 07 Posts: 7105 Credit: 147,663,825 RAC: 5
|
Winner until now: -unroll 5 -ffa_block 1472 -ffa_block_fetch 368 -hp -tune 1 64 2 1 -oclFFT_plan 32 8 256 : Elapsed 993.624 secs CPU 22.031 secs - 1st -unroll 5 -ffa_block 1472 -ffa_block_fetch 368 -hp -tune 1 64 2 1 -oclFFT_plan 32 8 256 : Elapsed 992.701 secs CPU 23.313 secs - 2nd -unroll 5 -ffa_block 1472 -ffa_block_fetch 368 -hp -tune 1 64 2 1 -oclFFT_plan 32 8 256 : Elapsed 992.907 secs CPU 22.531 secs - 3rd ..........................................................................................................................Elapsed 993.077 secs CPU 22.625 secs (average) Then I tested the above cmdline settings with additional (each alone): -skip_ffa_precompute : Elapsed 1014.339 secs CPU 22.344 secs -skip_ffa_precompute : Elapsed 1014.311 secs CPU 21.734 secs -skip_ffa_precompute : Elapsed 1015.398 secs CPU 21.047 secs ................................Elapsed 1014,683 secs CPU 21,708 secs (average) -sbs 32 : Elapsed 995.386 secs CPU 15.766 secs -sbs 32 : Elapsed 993.232 secs CPU 22.969 secs -sbs 32 : Elapsed 995.667 secs CPU 16.453 secs .............Elapsed 994,762 secs CPU 18,396 secs (average) -sbs 64 : Elapsed 1007.123 secs CPU 17.188 secs -sbs 64 : Elapsed 1007.349 secs CPU 16.188 secs -sbs 64 : Elapsed 993.998 secs CPU 22.094 secs .............Elapsed 1002,823 secs CPU 18,490 secs (average) -sbs 128 : Elapsed 993.249 secs CPU 22.844 secs -sbs 128 : Elapsed 1008.278 secs CPU 16.313 secs -sbs 128 : Elapsed 996.167 secs CPU 15.906 secs ...............Elapsed 999.231 secs CPU 18,354 secs (average) -cpu_lock : Elapsed 992.821 secs CPU 22.797 secs -cpu_lock : Elapsed 992.910 secs CPU 22.313 secs -cpu_lock : Elapsed 992.504 secs CPU 22.563 secs ................Elapsed 992.745 secs CPU 22,558 secs (average) -use_sleep : Elapsed 1088.208 secs CPU 11.531 secs -use_sleep : Elapsed 1088.534 secs CPU 11.797 secs -use_sleep : Elapsed 1094.064 secs CPU 17.078 secs ..................Elapsed 1090,269 secs CPU 13,469 secs (average) This are the final/fastest settings for the ap_cmdline_win_x86_SSE2_OpenCL_Intel.txt file ...? -unroll 5 -ffa_block 1472 -ffa_block_fetch 368 -hp -tune 1 64 2 1 -oclFFT_plan 32 8 256 -cpu_lock -instances_per_device 1 BTW. I see now, I forgot to set '-instances_per_device 1' as I made the bench test run with '-cpu_lock'. Is this a failure? This was all? I found the fastest settings? BTW. I see it correct that the 4 CPU-threads of the Intel® Celeron® J1900 (it says 2MB) have just one L2-Cache (no cache miss possible?)? BOINC v7.4.42 say: Cache 1024KB, so maybe there are 2x 1MB, 2 CPU-threads with one L2-Cache each (cache miss possible?)? Thanks.
ID: 1662581 · |
|
HAL9000 Send message Joined: 11 Sep 99 Posts: 6534 Credit: 196,805,888 RAC: 57
|
Silvermont SOC (Avoton, BayTrail, & etc...) have 1MB cache for each 2 CPU cores. http://images.anandtech.com/doci/7314/Screen%20Shot%202013-09-11%20at%208.27.39%20AM.png You can also see when using CPUz under cache "Level 2: 2x 1024 KBytes".  SETI@home classic workunits: 93,865 CPU time: 863,447 hours Join the [url=http://tinyurl.com/8y46zvu]BP6/VP6 User Group[
ID: 1662591 · |
|
Josef W. Segur Send message Joined: 30 Oct 99 Posts: 4504 Credit: 1,414,761 RAC: 0
|
... The default is 1, the setting is only needed when trying to run more than one instance on the GPU. Joe ID: 1662616 · |
|
Sutaru Tsureku Send message Joined: 6 Apr 07 Posts: 7105 Credit: 147,663,825 RAC: 5
|
Thanks to all here in this thread! 2x L2-Cache, thanks, OK, then -cpu_lock is a 'must'. ;-) It's possible to make Intel® iGPU MB bench test run also? Or is there nothing to set? Thanks. EDIT: Added '(e.g. @ J1900)' to the topic.
ID: 1663618 · |
|
HAL9000 Send message Joined: 11 Sep 99 Posts: 6534 Credit: 196,805,888 RAC: 57
|
Thanks to all here in this thread! I think it is good to note these values are for BayTrail iGPU. As Haswell & IvyBridge have single shared cache. Which may be the reason for massive slow down in CPU that has been seen when using iGPU. SETI@home classic workunits: 93,865 CPU time: 863,447 hours Join the [url=http://tinyurl.com/8y46zvu]BP6/VP6 User Group[
ID: 1663626 · |
|
Raistmer Send message Joined: 16 Jun 01 Posts: 6325 Credit: 106,370,077 RAC: 121
|
As I recall someone on forums attempted to use vTune to catch that slowdown and no increase in cache misses was detected. Accordingly Dirk's clInfo log CPU and GPU parts of Intel's APU have different amount of cache. All this just indirect witnesses of course but it's really hard to accept physically common cache between CPU and GPU parts. It would mean complete CPU cache invalidation on time scale much less than fraction of microsecond some times.... Do you have any links regarding that cache sharing? ID: 1663667 · |
|
HAL9000 Send message Joined: 11 Sep 99 Posts: 6534 Credit: 196,805,888 RAC: 57
|
I was trying to use Intel vTune some time ago to hunt down the issue. I'm not sure if that is what you were remembering, or maybe someone else was also using it? From my captures I was not able to determine any differences between the iGPU & CPU apps when they were running alone or at the same time. Given the large volume of data generated by each capture it is certainly possible I missed something. As I am not as familiar with the apps & how they function. Diagrams for the various CPUs do not show a separate cache for the iGPU. Except those that have GT3e GPU, Iris Pro Graphics 5200/6200. "GT3e, the same as GT3 but with addition of a large 128 MB embedded DRAM (eDRAM) cache to improve performance of bandwidth-limited workloads". In my mind having two separate bits of cache makes sense to me as why BayTrail doesn't see the same issue, but it could be the architecture as well. Silvermont/BayTrail is said to be "out-of-order architecture", but is IvyBridge & Haswell also? I would guess maybe not. SETI@home classic workunits: 93,865 CPU time: 863,447 hours Join the [url=http://tinyurl.com/8y46zvu]BP6/VP6 User Group[
ID: 1663683 · |
|
Raistmer Send message Joined: 16 Jun 01 Posts: 6325 Credit: 106,370,077 RAC: 121
|
Silvermont/BayTrail is said to be "out-of-order architecture", but is IvyBridge & Haswell also? I would guess maybe not. These days only Atoms are in-order ones. out-of-order architecture was introduced with P4 perhaps if not earlier. Well, to have common cache will equire full snooping implementation for cache-coherency ensurement between CPU and GPU parts also. Interesting to see some definitive info on this topic. Maybe even worth to ask on Intel's forums themselves... BTW, not all APU have GPU cache at all. For example my C-60 reported by clInfo as having no GPU cache (it has CPU cache of course). ID: 1663761 · |
|
Marco Franceschini Send message Joined: 4 Jul 01 Posts: 54 Credit: 69,877,354 RAC: 135 
|
Out-of-order architecture was introduced by Intel in its P6 family i.e Pentium Pro processor in the '90s. http://en.wikipedia.org/wiki/Pentium_Pro Marco. ID: 1664011 · |
|
Raistmer Send message Joined: 16 Jun 01 Posts: 6325 Credit: 106,370,077 RAC: 121
|
Out-of-order architecture was introduced by Intel in its P6 family i.e Pentium Pro processor in the '90s. Thanks for clarification, it's even earlier than I supposed. Interesting why they rejected from out of order architecture with Atoms (keeping hyperthreading included, for example)... ID: 1664054 · |
|
Raistmer Send message Joined: 16 Jun 01 Posts: 6325 Credit: 106,370,077 RAC: 121
|
Sorry for hijacking thread a little, but it's iGPU performance related and maybe result in some additional software tuning (that belongs to benchmarking area) so I'll continue this line here: Thread regarding CPU slowdown when GPU part of APU used (on Intel's forums): https://software.intel.com/en-us/forums/topic/549624 If someone has additional ideas what to ask/check post there (or here or PM - I'll try to ask). ID: 1664056 · |
|
HAL9000 Send message Joined: 11 Sep 99 Posts: 6534 Credit: 196,805,888 RAC: 57
|
Out-of-order architecture was introduced by Intel in its P6 family i.e Pentium Pro processor in the '90s. I had read "Silvermont is the first Atom processor to feature an out-of-order architecture." & didn't find that kind of Information for Haswell. So that was my source of confusion. Haswell didn't list it because it was done to mainstream desktop processors so long ago. I also notice that clinfo reports this information for the CPU too. had I looked there sooner I would not have been confused. Also full clinfo output from Bay Trail Celeron J1900 & Haswell i5-4670K if it is useful. I was planning to setup one of my i5-4670K with vTune in a clean OS to look at the DRAM values as listed in the Intel forum post. It looks like I left my flash drive with the install on it at work & I don't recall my Intel login to download it from home. So that will have to wait until Monday after work, ~21:00 UTC, for me. I would think that if it were memory saturation issue. Then number of CPU tasks could be reduced to solve over saturation, but same CPU slowdown occurs with 1 CPU task running. Given Silvermont/Bay Trail has less memory bandwidth than Ivy Bridge & Haswell. Shouldn't the issue be even worse for Bay Trail if memory saturation is the issue? Maybe the Intel person will answer your question on how cache is used with CPU & iGPU. SETI@home classic workunits: 93,865 CPU time: 863,447 hours Join the [url=http://tinyurl.com/8y46zvu]BP6/VP6 User Group[
ID: 1664394 · |
|
Marco Franceschini Send message Joined: 4 Jul 01 Posts: 54 Credit: 69,877,354 RAC: 135
|
http://www.realworldtech.com/ivy-bridge-gpu/6/ http://wccftech.com/haswell-die-configurations-intel-ivy-bridge-revealed/ Without external eDRAM contentions are not avoidable. http://www.pcworld.com/article/240016/idf_day_1_recap_ivy_bridge_and_the_x79_factor_in_photos.html  Marco. ID: 1664442 · |

©2024 University of California
SETI@home and Astropulse are funded by grants from the National Science Foundation, NASA, and donations from SETI@home volunteers. AstroPulse is funded in part by the NSF through grant AST-0307956.