Estimates and Deadlines revisited
Message boards :
Number crunching :
Estimates and Deadlines revisited
Message board moderation
| Author | Message |
|---|---|
|
Josef W. Segur Send message Joined: 30 Oct 99 Posts: 4504 Credit: 1,414,761 RAC: 0 
|
I gathered data on 15 hosts running stock 5.27 over an 8 day period in early September. Those hosts were chosen by going back 1200 places in the top computers list and simply selecting the first 15 I found running stock applications. The goal was to derive a new set of estimate formulas, but the data had too many variations so I put that effort on hold. Last week I decided to try an alternate approach, running a series of standalone tests at angle ranges chosen to show how variations in crunch time correlate with the variations in floating point counts. I chose angle ranges representing the start and end of vertical sections in my flop count chart and additional points such that each relatively smooth section of the flop count chart was represented by 4 points. Chirp limits were reduced to 3 and 10 so the initial tests with 49 WUs only took 25 hours on my Pentium-M system using stock 5.27. The initial tests showed some crunch time variations within the band where Gaussian fitting is done which deserved further testing so I eventually ended up with 70 angle ranges. Those variations are jumps in crunch time at points where the integer number of data points which fit within one beam width changes, but not all such; angle ranges 0.29091, 0.35556, 0.45714, 0.64, and 1.06667. Here's the graph of the 70 measured times with connecting line, and the flop count graph for comparison (380x756, 4686 bytes): 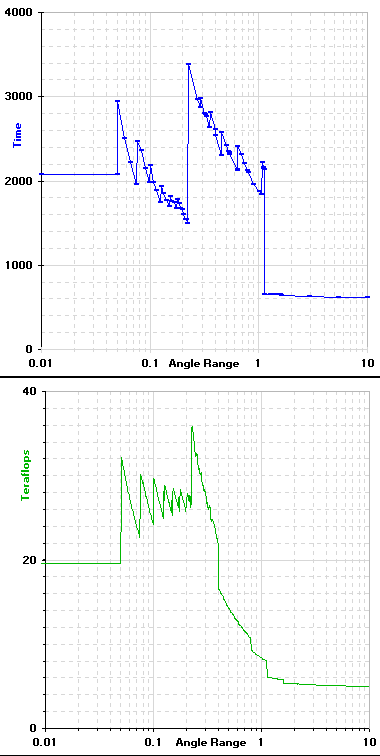 The significant difference between the graphs shows why a pure approach based on an estimate of flops won't provide stable time estimates. Although the value is called <rsc_fpops_est> it is only used for time calculations and should be estimated on that basis. So I fitted curves to the time graph and made some adjustments to compensate for weaknesses of the testing method. Then I scaled those estimation formulas to compare against the data from the 15 hosts. This image is a matrix showing all 15 with the estimate curves in magenta and CPU times of the hosts in blue scatter plot. Each graph covers 4 decades of angle range from 0.001 to 10 (624x720, 9298 bytes): 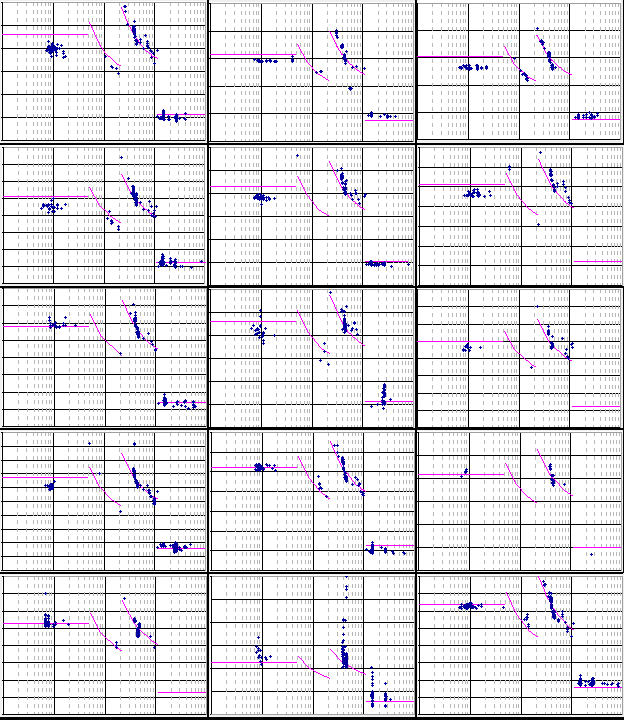 Obviously these estimates aren't a perfect fit for any given host, and there will still be variations in Duration Correction Factor as BOINC tries to adjust. All those hosts have at least 2 cores, so contention effects also add to the variations. I never hoped for perfection, just something much better than we now have. Here's a comparative plot with the CPU times for my Pentium-M running lunatics 2.4 PM build in green, my new estimates in magenta, and the old estimates in orange (466x294, 2679 bytes): 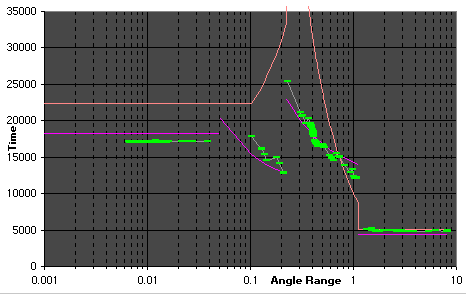 As you can see, the new curves match at least this particular optimized version fairly well. Given enough data I'm sure a better approximation could be found but this is good enough, I think. If any of you saving data to produce your own plots want to add the curves, here are some formulas: AR 0 through 0.05: N * 1.02 AR 0.05+ thru 0.22548: N * (0.586 + 0.028/AR) AR 0.22549 thru 1.1274: N * (0.66 + 0.14/AR) AR 1.1275 and up: N * 0.247 The 'N' value should be about the time the host takes to do an AR=0.41 WU. Here's the effect the new estimates would have on deadlines.
        Deadline(days)
  AR     old     new
-----  ------   -----
0.050   38.19   30.57
0.051   29.86   34.02
0.083   34.80   27.67
0.136   42.98   23.73
0.225   56.71   21.29
0.226  109.93   38.35
0.312   73.46   33.23
0.429   49.34   29.56
0.593   32.92   26.86
0.817   22.05   24.92
1.127   14.75   23.50
1.128    8.68    7.40
Joe ID: 692684 · |
|
Brian Silvers Send message Joined: 11 Jun 99 Posts: 1681 Credit: 492,052 RAC: 0
|
Could you, or anyone else for that matter, make sure that Eric and/or someone on the project staff gets a look at this information?
ID: 692756 · |
Richard Haselgrove  Send message Joined: 4 Jul 99 Posts: 14650 Credit: 200,643,578 RAC: 874 
|
Joe, congratulations! A very useful bit of research, clearly argued and well presented with supporting data. Most impressive. Can I suggest that some of us with high-speed access give Joe's poor old modem a rest, and validate Joe's results by running Fred W's data collector over some stock crunchers? I have lots of historical data, but almost all of it is for optimised apps: I think it will be easier to convince Eric and the lab team to adopt Joe's curve if we can demonstrate its validity for the three main stock app platforms (Windows, Mac and 'nix). We seem to be lucky (Murphy's law permitting) in that recent tapes seem to have a wide variety of AR recordings, so now would be a good time to do the data capture. The really important thing about the proposed new curve is that it brings those extreme deadlines (73 and 109 days) back to reality, without compromising the ability of those with slow machines (whether by low resource share, short times spent crunching, or simply older hardware) to participate fully in the project. ID: 692769 · |
|
Fred W Send message Joined: 13 Jun 99 Posts: 2524 Credit: 11,954,210 RAC: 0
|
Joe, congratulations! A worthy task - happy to participate. Not sure how to locate appropriate hosts for each platform, though (no good scrolling down the Top Hosts list as those will all be Optimised). Also need to avoid duplication - don't want several people looking at the same host. Any suggestions? F. 
ID: 692785 · |
|
Richard Haselgrove Send message Joined: 4 Jul 99 Posts: 14650 Credit: 200,643,578 RAC: 874
|
Joe, congratulations! I'm going to adapt Joe's method, and look at top computers (to get lots of data), but with a substantial offset to miss out the main optimisers. Starting at 500, my first random pick was host 3677428. I'll carry on looking through top hosts 500-599 inclusive, looking for stock apps (and standard BOINCs, come to that). I suggest anyone else joining in picks a 'top host' range and declares it in this thread: there may be minor overlaps at the margins as they jostle for position, but that shouldn't matter too much. Edit - when setting the configuration tab labels, I suggest we concentrate on CPU and OS. My first was 'X5355 Windows server 2003' ID: 692792 · |
|
Richard Haselgrove Send message Joined: 4 Jul 99 Posts: 14650 Credit: 200,643,578 RAC: 874
|
OK, my monitoring list reads: 3677428 X5355 Windows server 2003 3605815 Intel Quad Windows XP 3950644 Q6600 Windows XP 3229377 Q6600 Windows Vista 2965688 X5160 Darwin 8.11.1 4037247 E5345 Gentoo Linux 2.6.22 4011908 E5335 Xen Linux 2.6.22 3009870 X5160 Darwin 8.11.1 3253554 X5365 Darwin 8.11.1 3117194 Intel Quad FC8 Linux 2.6.23 I think that's enough for one machine - since they all came from top hosts 501-550, I hereby release 551 and upwards for someone else to have a go at. NB I haven't got any AMDs in the list - there were only two in my (shortened) range, and both were running optimised. Someone (where's Tony when you need him?) might like to concentrate of finding some stock AMDs to validate. ID: 692795 · |
|
Fred W Send message Joined: 13 Jun 99 Posts: 2524 Credit: 11,954,210 RAC: 0
|
OK, my monitoring list reads: Fair warning then: I'm targetting AMDs from 550 on. I'll post a list when I have identified a few to see if lack of familiarity with the AMD range has left any glaring holes. F.
ID: 692798 · |
|
Richard Haselgrove Send message Joined: 4 Jul 99 Posts: 14650 Credit: 200,643,578 RAC: 874
|
First data from the hosts I selected for monitoring:  (direct link) Notes: 1) The yellow 'line' is Joe's suggested curve. I haven't worked out how to overlay a curve on a scattergram in Excel yet, so this will have to do for now! 2) The machines I've chosen run at different speeds, so I've normalised the graph by declaring N=10,000, and adjusting the actual run times accordingly. I've normalised by using the actual run time closest to AR=0.41: sometimes there wasn't a WU particularly close, so this approach could probably be improved. 3) One thing I wasn't able to control for was varying CPU speeds during the period for which data was available. I suspect the owner of the machine I've identified as 'Q6600_Windows_XP' may have changed their overclock somewhere in the middle of all this: my first attempt at normalisation had a lot of dark green spots below Joe's line in the AR=0.4 region. 4) At VLAR, Joe's line is very good for all the windows machines, but Mac and Linux both seem to be more efficient in this area. So we'll never achieve perfection! ID: 692849 · |
|
Josef W. Segur Send message Joined: 30 Oct 99 Posts: 4504 Credit: 1,414,761 RAC: 0
|
Could you, or anyone else for that matter, make sure that Eric and/or someone on the project staff gets a look at this information? Eric is definitely the target, and I'll make a specific recommendation to him sometime. Meanwhile I very much appreciate Richard and Fred gathering more supporting information, and that may lead to some modifications based on common angle ranges (ARs). We ought to be able to establish the best compromise ratio between VLAR (0 - .05 AR) and VHAR (1.128 and up), and the ratios from those to work near 0.40 AR. Those three areas represent something like 95% of the work, getting the balance right will stabilize Duration Correction Factor as much as possible. For reference, here are the 15 hosts on which I gathered info in September: 1755696 Intel Xeon 5160 @ 3.00GHz, CPU count: 4, Darwin 9.1.0 2315607 Intel Xeon 5150 @ 2.66GHz, CPU count: 4, Darwin 8.11.1 2370791 Dual Core AMD Opteron 275, CPU count: 4, Linux 2.6.18-53.1.4.el5 2402518 Dual Core AMD Opteron 270, CPU count: 4, Linux 2.6.23.8-63.fc8 3004905 MacPro1,1, CPU count: 4, Darwin 9.0.0 3269375 Intel Core 2 CPU T7600 @ 2.33GHz, CPU count: 2, Darwin 8.11.1 3332596 Intel Xeon 5140 @ 2.33GHz, CPU count: 4, Windows XP 3368721 Intel Xeon X5365 @ 3.00GHz, CPU count: 8, Darwin 8.11.1 3454920 Intel Core 2 Duo CPU T7700 @ 2.40GHz, CPU count: 2, Darwin 8.11.1 3591957 Intel Xeon 5120 @ 1.86GHz, CPU count: 4, Linux 2.6.9-34.ELsmp 3597407 Intel Core 2 Quad @ 2.40GHz, CPU count: 4, Windows Vista 3628998 Intel Core 2 CPU X6800 @ 2.93GHz, CPU count: 2, Windows XP 3669880 Dual-Core AMD Opteron 2218, CPU count: 4, Windows Server 2003 3698032 Intel Core 2 Quad @ 2.40GHz, CPU count: 4, Windows XP 3714185 Intel Xeon X5355 @ 2.66GHz, CPU count: 8, Windows Server 2003 Joe ID: 692852 · |
 Geek@Play Geek@Play Send message Joined: 31 Jul 01 Posts: 2467 Credit: 86,146,931 RAC: 0
|
Sorry this is off subject but I wanted to get Joe's attention. I humbly request you create a profile on your account. Your background seems to be very extensive, you offer many suggestions for this project and I am just curious about your background. You seem to be very knowledgeable in many areas and I would like to know more about you. Thanks ID: 692855 · |
|
Richard Haselgrove Send message Joined: 4 Jul 99 Posts: 14650 Credit: 200,643,578 RAC: 874
|
Back to the subject: I've plugged Joe's list into a copy of Fred's sucker, and I'll get some up-to-date numbers to add to the September collection. Editing, from a different machine: the machine I was using for research suddenly got a rash of "403: forbidden" from all SETI-related web pages. So I assume I've overcooked the data-collection: I apologise, and I won't now be updating Joe's list. Other people running Fred's data collection tool are warned not to be over-enthusiastic in their DoS attack on the SETI servers! ID: 692857 · |
|
Brian Silvers Send message Joined: 11 Jun 99 Posts: 1681 Credit: 492,052 RAC: 0
|
Back to the subject: I've plugged Joe's list into a copy of Fred's sucker, and I'll get some up-to-date numbers to add to the September collection. No, it wasn't that... I think someone was tinkering with the web servers... I got the 403 error as well... ID: 692859 · |
|
Brian Silvers Send message Joined: 11 Jun 99 Posts: 1681 Credit: 492,052 RAC: 0
|
While I understand that in theory the curve should work on slower hosts, would it not be a good idea to get some slower hosts and do the data plotting on them as well, just to be certain? ID: 692860 · |
|
Richard Haselgrove Send message Joined: 4 Jul 99 Posts: 14650 Credit: 200,643,578 RAC: 874
|
While I understand that in theory the curve should work on slower hosts, would it not be a good idea to get some slower hosts and do the data plotting on them as well, just to be certain? Absolutely: feel free to pick a host and join the party. (Just go easy on the data collection, okay??!!) ID: 692863 · |
|
Dissident Send message Joined: 20 May 99 Posts: 132 Credit: 70,320 RAC: 0 
|
Fair warning then: I'm targetting AMDs from 550 on. I'll post a list when I have identified a few to see if lack of familiarity with the AMD range has left any glaring holes. Pick me, pick me! :p I run 2 AMD's, one 939 dualie and one Turion... ID: 692920 · |
|
Fred W Send message Joined: 13 Jun 99 Posts: 2524 Credit: 11,954,210 RAC: 0
|
Fair warning then: I'm targetting AMDs from 550 on. I'll post a list when I have identified a few to see if lack of familiarity with the AMD range has left any glaring holes. Love to - but one of the primary criteria is "running Stock App" and both your's (like most who contribute here) are running Optimised Apps. F.
ID: 692930 · |
|
Dennis Send message Joined: 26 Jun 07 Posts: 153 Credit: 15,826,319 RAC: 0
|
I am running 2 AM2's, an AMD 6400 on XP and an AMD 6000 on Vista, also some AMD 939 4800's on XP, all stock apps, hope this is helpful. Except for an area wide power outage for many hours just yesterday all run SETI 24/7. ID: 692939 · |
|
Richard Haselgrove Send message Joined: 4 Jul 99 Posts: 14650 Credit: 200,643,578 RAC: 874
|
Back to the subject: I've plugged Joe's list into a copy of Fred's sucker, and I'll get some up-to-date numbers to add to the September collection. Well, several people have reassured me that I wasn't personally responsible for the total crash of the web server earlier this afternoon, so I've taken my life in my hands and tried re-running Joe's list. Some of them seem to have stopped crunching, but I've collected what was available: too late now for analysis, I'll have another look in the morning. But nobody else needs collect that dataset. I'll leave Dennis's kind offer to Fred's collection of AMD, probably also later this morning. ID: 692946 · |
|
Josef W. Segur Send message Joined: 30 Oct 99 Posts: 4504 Credit: 1,414,761 RAC: 0
|
While I understand that in theory the curve should work on slower hosts, would it not be a good idea to get some slower hosts and do the data plotting on them as well, just to be certain? I was thinking along similar lines, but also wanted a selection of single core systems where the curve won't be blurred by contention effects. The top computers list is cut off at 10000, and I couldn't find any single core systems in the 9700+ range. What I ended up doing was looking at the SETI@home host list on BOINCSTATS (Thanks, Willy!), sorted by credit in the last day. I started at 15000 back and found a few single core systems per page of 100. I wrote down the host IDs extracted from the link to the individual host graphs. When I finished with a page of 100, I used the link to go further back by 500 just to get a better spread. I ended up with a list of 57 hosts by the time I'd finished with the page starting at 18500 back. Out of those I got a list of 34 running the stock app for which I'll gather at least enough data to establish the ratios I noted earlier. Gathering the data is no problem even on dial-up, analyzing it is more time-consuming. The range of Intel systems runs from a mobile PIII through a Celeron 440 (Conroe-L), and the AMD systems also cover a broad range. BOINCSTATS breakdown by host type indicates that about 23% of the total credits for this project have been earned by the top 4 types, P4 systems in the 2.4GHz to 3.2GHz range. Those are probably mostly Prescotts running HT rather than the Northwoods my list has captured. The current rate at which those systems are earning credit is probably a much smaller fraction, but not insignificant. It might be good if someone tried for a set of Prescotts just in case. I really don't expect to see very different curve shapes by CPU type, though. Joe ID: 692980 · |
|
Fred W Send message Joined: 13 Jun 99 Posts: 2524 Credit: 11,954,210 RAC: 0
|
I am running 2 AM2's, an AMD 6400 on XP and an AMD 6000 on Vista, also some AMD 939 4800's on XP, all stock apps, hope this is helpful. Except for an area wide power outage for many hours just yesterday all run SETI 24/7. Thanks, Dennis. I have been having great difficult identifying suitable AMDs by working down the top hosts list. I think I had found about 3 from the top 2000 when the "Forbidden" hit us and trashed the instance of Excel that I was saving them in. I will do a run on yours' this morning and try to find some more later on today. F.
ID: 693012 · |

©2024 University of California
SETI@home and Astropulse are funded by grants from the National Science Foundation, NASA, and donations from SETI@home volunteers. AstroPulse is funded in part by the NSF through grant AST-0307956.