Scientific Newsletter - June 19, 2000
|
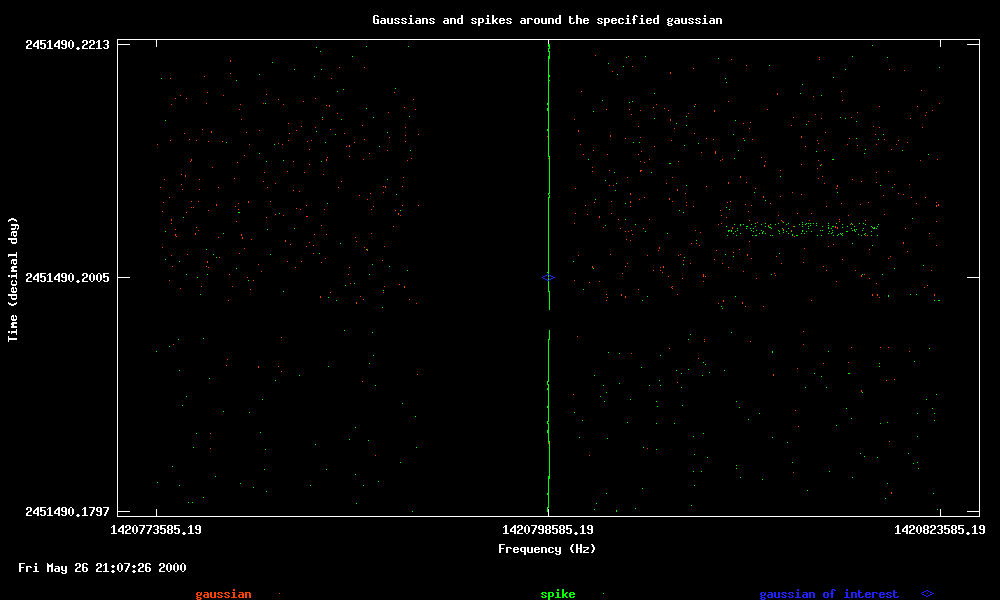
Multiple Detection Search Stan Corroyer - Visiting Scholar from the Ecole Polytechnique (France) Since the beginning of the SETI@home project, SETI@home users have found about 60 million gaussians using the screensaver client program. A great deal of these gaussians are the result of background noise in the universe. However, if extraterrestrials were sending us a strong signal, we should be able to detect it coming from roughly the same place in the sky on two different occasions. The first step in analysing the SETI@home gaussian results is to search through the database for pairs or triplets of gaussians that would indicate such an extraterrestrial signal. Since searching over 60 millions gaussians would take a while, the initial search consisted of only the top 10000 ones, that is, the strongest ones with best gaussian fits. The initial search looked for gaussians that were found in the same area - i.e. both sky coordinates (right ascension and declination) at most 5 arcminutes apart (this is half a beam width) - and frequencies within 100kHz of each other. Three interesting "triplets" came out of this search, and all of them were more carefully analysed by plotting a time and frequency map of all other results in the database, centered on the specified frequency at which the triplet was found. The pictures below come from the first triplet that interested us. You can click on each of the images to enlarge them.
From the graphs, it appears the detected signals resulted from RFI (Radio Frequency Interference). This is why there are so many dots (almost making a line) at a particular frequency for the entire time scale. See the narrowband interference section on the RFI page for more details. On the right side of the first picture, broadband interference is evident from the two thick stripes running down the graph. After careful analysis, it was determined that the two other "triplets" seemed to be RFI too, as displayed by the pictures below. Notice the green rectangle on the right portion of the second plot. These are the results from a single workunit. We are not yet sure why bad results were returned for this workuit and are exploring it further. Another such area can be seen faintly in the upper left portion of the first plot. The large black area surrounding the narrowband signal is caused by the client reaching the result limit due to the radio frequency interference, resulting in only the highest powered signals being returned for that workunit. In this instance, the highest powered signals were limited to the narrowband RFI visible in the plot. This also explains the square blank area in the first plot of the first set, above. In this case, the RFI was strong enough to overrun the result limit in the blank area but weak enough above and below that area to allow other signals to be returned.
Well... We didn't find E.T. on our initial analysis... We will continue to keep you informed as our analysis continues! |


©2024 University of California
SETI@home and Astropulse are funded by grants from the National Science Foundation, NASA, and donations from SETI@home volunteers. AstroPulse is funded in part by the NSF through grant AST-0307956.