Loading APU to the limit: performance considerations - ongoing research
Message boards :
Number crunching :
Loading APU to the limit: performance considerations - ongoing research
Message board moderation
Previous · 1 · 2 · 3 · Next
| Author | Message |
|---|---|
 HAL9000 HAL9000 Send message Joined: 11 Sep 99 Posts: 6534 Credit: 196,805,888 RAC: 57 
|
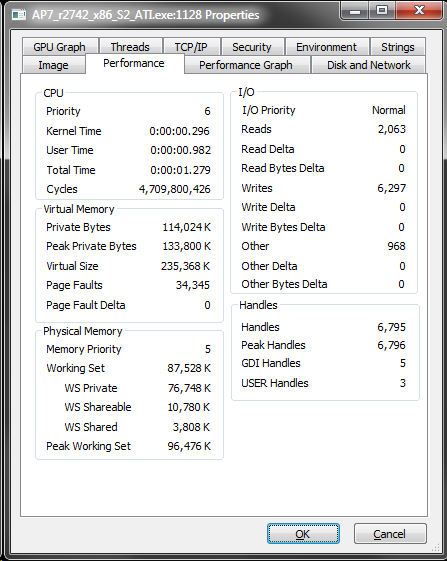
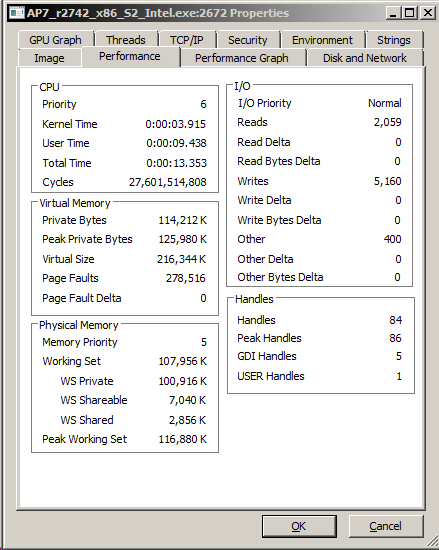
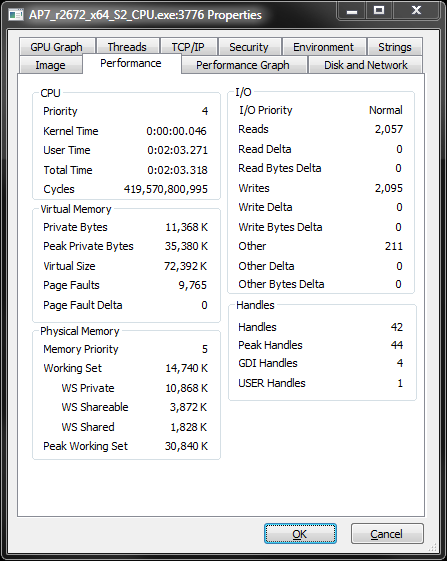
Could issue be related to page faults? Using MS Processes Explorer I monitored apps & noticed very large number of page faults for iGPU app. At least when compared to ATI app of same version. Running iGPU app with Clean_01LC.wu http://hal6000.com/seti/test/apbench_procexp_i5-4670k_cpu0_igpu1.png Running ATi app with Clean_01LC.wu http://hal6000.com/seti/test/apbench_procexp_i5-4670k_cpu0_ati1.png Running iGPU app with Clean_01LC.wu http://hal6000.com/seti/test/apbench_procexp_celeron-j1900_cpu0_igpu1.png When running with CPU app iGPU looks very similar to when running without CPU. Running 1 CPU & iGPU app with Clean_01LC.wu http://hal6000.com/seti/test/apbench_procexp_i5-4670k_cpu1_igpu1.png Running 4 CPU & iGPU app with Clean_01LC.wu http://hal6000.com/seti/test/apbench_procexp_i5-4670k_cpu4_igpu1.png Also CPU app solo has similar results each time as well. http://hal6000.com/seti/test/apbench_procexp_i5-4670k_cpu1_igpu0.png SETI@home classic workunits: 93,865 CPU time: 863,447 hours  Join the [url=http://tinyurl.com/8y46zvu]BP6/VP6 User Group[ Join the [url=http://tinyurl.com/8y46zvu]BP6/VP6 User Group[
ID: 1666528 · |
|
Bill Butler Send message Joined: 26 Aug 03 Posts: 101 Credit: 4,270,697 RAC: 0
|
Currently work in progress so welcome: http://lunatics.kwsn.net/1-discussion-forum/loading-apu-to-the-limit-performance-considerations.msg58456.html#msg58456 Upon trying the link I get "The domain "kwsn.net" has expired." Is there another link for this?. (My regards and great admiration to all Cosmonauts past and now present on the ISS and now, too, those brave souls contemplating a move to a new life on Mars. I hope a radio scope will go with the Mars expedition and we will hear signals without so much RFI.) "It is often darkest just before it turns completely black." ID: 1666574 · |
|
HAL9000 Send message Joined: 11 Sep 99 Posts: 6534 Credit: 196,805,888 RAC: 57
|
Currently work in progress so welcome: http://lunatics.kwsn.net/1-discussion-forum/loading-apu-to-the-limit-performance-considerations.msg58456.html#msg58456 http://setiathome.berkeley.edu/forum_thread.php?id=77089 SETI@home classic workunits: 93,865 CPU time: 863,447 hours Join the [url=http://tinyurl.com/8y46zvu]BP6/VP6 User Group[
ID: 1666628 · |
|
BilBg Send message Joined: 27 May 07 Posts: 3720 Credit: 9,385,827 RAC: 0 
|
Just change .net to .info http://lunatics.kwsn.info/1-discussion-forum/loading-apu-to-the-limit-performance-considerations.msg58456.html#msg58456 Â   - ALF - "Find out what you don't do well ..... then don't do it!" :) - ALF - "Find out what you don't do well ..... then don't do it!" :)Â ID: 1666630 · |
|
Raistmer Send message Joined: 16 Jun 01 Posts: 6325 Credit: 106,370,077 RAC: 121 
|
Could issue be related to page faults? Very interesting catch. I suppose ATi is discrete GPU in your test? If so one should not expect big page faults there. But difference between Haswell and BayTrail not so easy to explain. Can you check what memory amount GPU-Z shows (if shows at all) as "dedicated" for both iGPUs ? Also, what memory reserved for iGPU in BIOS on both machines? EDIT: I suppose those are "soft" faults when memory page needs to be allocated for process, not to be loaded from HDD's swap. That means, on Haswell app constantly allocates memory buffers while on BayTrail this allocation much smaller. Also, Jason mentioned soft faults as L3 cache misses. How to discriminate between those soft faults need to find out. ID: 1666783 · |
|
HAL9000 Send message Joined: 11 Sep 99 Posts: 6534 Credit: 196,805,888 RAC: 57
|
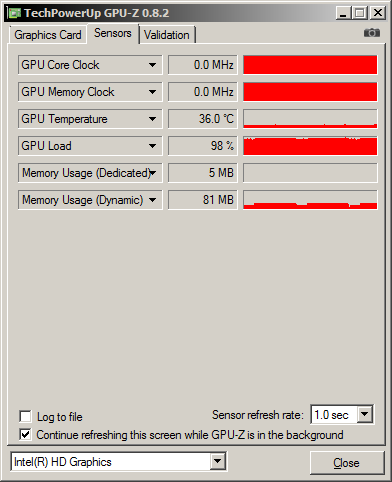
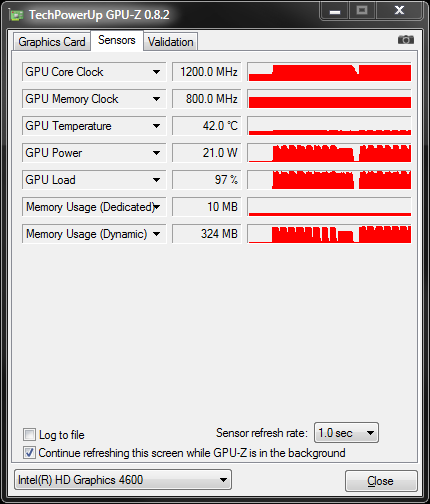
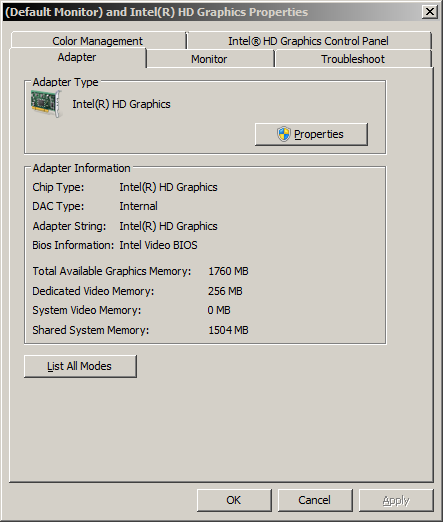
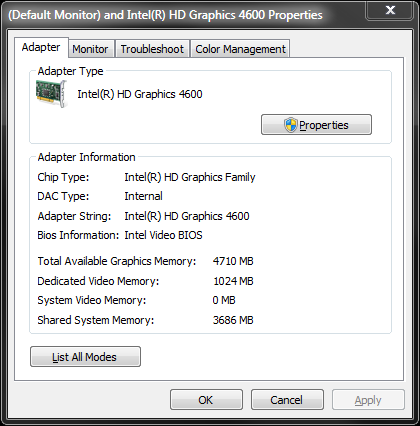
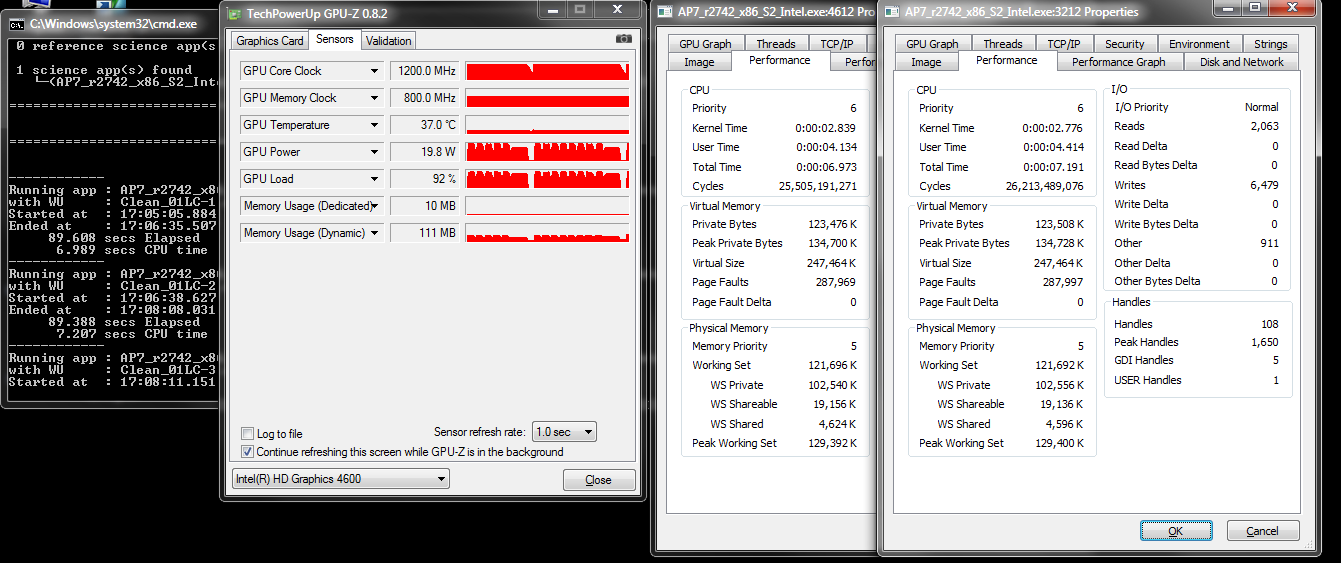
Could issue be related to page faults? Yes, the ATI is the HD6870 in Haswell system. Dedicated memory for each is different, but by only 5MB. http://hal6000.com/seti/test/apbench_gpuz_celeron-j1900_cpu0_igpu1.png http://hal6000.com/seti/test/apbench_gpuz_i5-4670k_cpu0_igpu1.png I am pretty sure BIOS is set to 256MB for both. I know BayTrail is as I had to redo all BIOS settings after upgrading this week. I will double check Haswell after posting & edit if different. Resource Monitor built into Windows 7 displays "Hard Faults/sec" column in the memory tab. It displays 0 at all times for SETI@home apps. I only see hard fault on MS apps like explorer.exe & perfmon.exe. So I guess page faults displayed by process explorer are "soft faults". EDIT: Graphics Memory Size for Haswell is set to 256MB just as BayTrail. Haswell has an additional setting "DVMT Total Memory Size" which BayTrail does not. It is also set to 256MB. Options are 128MB, 256MB, & MAX. Past tests on Haswell with memory settings showed DVMT did not seem to effect memory for OCL. So it may not be as important. Also of interest. iGPU memory displayed by windows. http://hal6000.com/seti/test/windows_mem_celeron-j1900.png http://hal6000.com/seti/test/windows_mem_i5-4670k.png SETI@home classic workunits: 93,865 CPU time: 863,447 hours Join the [url=http://tinyurl.com/8y46zvu]BP6/VP6 User Group[
ID: 1666940 · |
|
Raistmer Send message Joined: 16 Jun 01 Posts: 6325 Credit: 106,370,077 RAC: 121
|
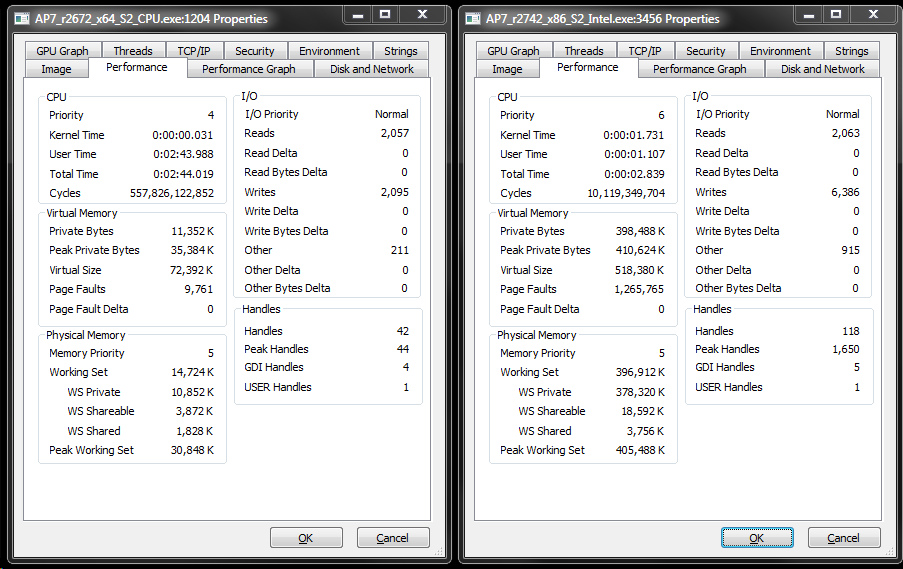
Well, seems Windows shows quite different amounts. But what bother me more your GPU-Z loads very different for those devices. Look, 81+5 for BayTrail ... and 10+ 324 (!) for Haswell. It can be because of different default FFA block and unrolling. Please upload somewhere raw data for your benches too for reference. And maybe worth to repeat some of most meaningful Haswell tests just with the same params (-unroll, -ffa_block) as BayTrail had by default. To check if reduced memory buffers pool influence on performance under full load. ID: 1666975 · |
|
HAL9000 Send message Joined: 11 Sep 99 Posts: 6534 Credit: 196,805,888 RAC: 57
|
Well, seems Windows shows quite different amounts. Previous raw data is located here. http://www.hal6000.com/seti/test/APBench_iGPU_Data.7z Started a new series of test using BayTrail iGPU values on Haswell. http://www.hal6000.com/seti/test/apbench_procexp_i5-4670k_cpu4_igpu1-2_baytrail_param.png So far run times look about the same, but will do 4, 3, 2, & 1 CPU test for completeness. SETI@home classic workunits: 93,865 CPU time: 863,447 hours Join the [url=http://tinyurl.com/8y46zvu]BP6/VP6 User Group[
ID: 1667004 · |
|
Raistmer Send message Joined: 16 Jun 01 Posts: 6325 Credit: 106,370,077 RAC: 121
|
And buffer sizes and page faults? I would expect buffer sizes now match between Haswell and BayTrail. Do they? And then would be interesting to compare number of page faults. If they remain strongly drifferent, then they can be factor that influence performance. But if they become similar, and execution times remain same as with prev run for Haswell... then apparently the root of issue lies somewhere else. ID: 1667600 · |
|
HAL9000 Send message Joined: 11 Sep 99 Posts: 6534 Credit: 196,805,888 RAC: 57
|
And buffer sizes and page faults? I would expect buffer sizes now match between Haswell and BayTrail. Do they? I wasn't thinking to check those values when I ran this previously. I was only looking at time. I noticed that Haswell has Max WG size of 512 vs 256 for BayTrail. So would it make sense to test -tune to adjust WG size? Maybe -tune 64 4 1 or -tune 32 8 1. SETI@home classic workunits: 93,865 CPU time: 863,447 hours Join the [url=http://tinyurl.com/8y46zvu]BP6/VP6 User Group[
ID: 1667729 · |
|
Raistmer Send message Joined: 16 Jun 01 Posts: 6325 Credit: 106,370,077 RAC: 121
|
Currently available tune options will not cover all kernel calls anyway. Some of them using default (NULL) local size so runtime free to use what it needs. But hardly WG size would affect on difference under consideration. iGPU has wave size of 32 or 64 (not clear what actual value is) and both less than WG size. So, switching between waves will be on both devices. And global buffer size (memory that needs to be accessed) will be the same as long as -unroll and -ffa_block set to the same values for both devices. Would be interesting to get page faults data for new config. ID: 1667734 · |
|
HAL9000 Send message Joined: 11 Sep 99 Posts: 6534 Credit: 196,805,888 RAC: 57
|
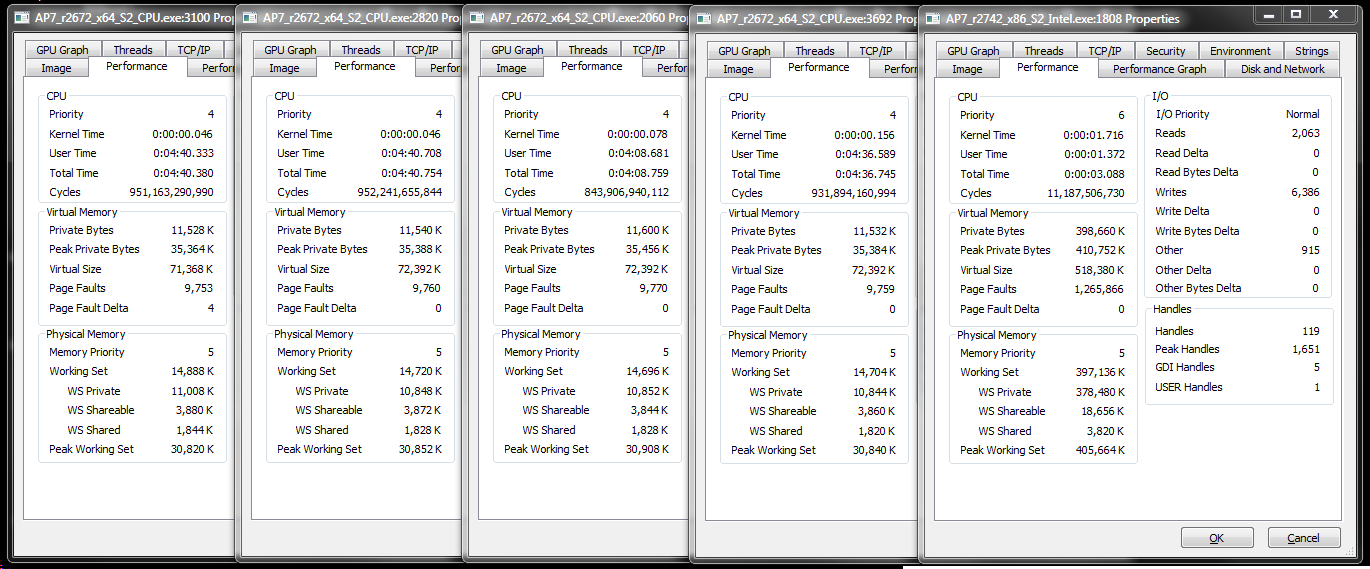
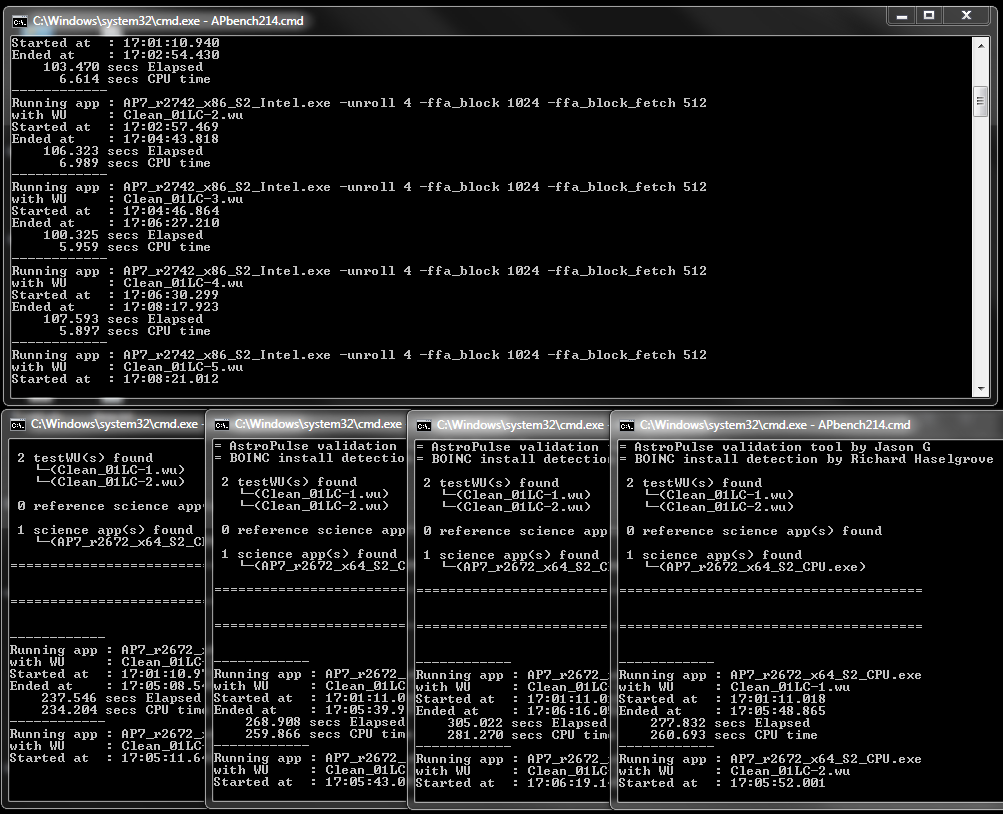
Memory use & page faults on Haswell are similar to Bay Trail when using BayTrail config. -unroll 4 -ffa_block 1024 -ffa_block_fetch 512 http://www.hal6000.com/seti/test/apbench_procexp_i5-4670k_cpu0_igpu1-2_baytrail_param.png CPU time is slightly changed by the different config. Around 10-15% for 4 & 3 CPU runs. Then 3-5% for 2 & 1 CPU runs. http://hal6000.com/seti/test/apbench_test_i5-4670k_btcfg.htm Note: This includes all new data as I change iGPU driver to newest to see if it had any effect. Looks like little to none when comparing to previous test. Associated APBench log files. http://hal6000.com/seti/test/APBench_iGPU_Data-2.7z SETI@home classic workunits: 93,865 CPU time: 863,447 hours Join the [url=http://tinyurl.com/8y46zvu]BP6/VP6 User Group[
ID: 1668222 · |
|
HAL9000 Send message Joined: 11 Sep 99 Posts: 6534 Credit: 196,805,888 RAC: 57
|
Would using a smaller config than BayTrail default be worth trying on Haswell? It looks like using BayTrail values on Haswell reduced CPU time & even iGPU time was slightly reduced too. Haswell Default -unroll 18 -ffa_block 5120 -ffa_block_fetch 2560 BayTrail Default -unroll 4 -ffa_block 1024 -ffa_block_fetch 512 There is minimum limit of 2 for -unroll, but is there also minimum limit for block & block_fetch? ReadMe doesn't mention. SETI@home classic workunits: 93,865 CPU time: 863,447 hours Join the [url=http://tinyurl.com/8y46zvu]BP6/VP6 User Group[
ID: 1669483 · |
|
Raistmer Send message Joined: 16 Jun 01 Posts: 6325 Credit: 106,370,077 RAC: 121
|
I think no real limit, even 1 could go, but need to check (maybe "foolproof system" will not allow such values ;) ) And yes, worth to check with lower values. What I would suggest then: 1) run on unloaded PC and find from what sizes Elapsed time stops fast decrease. 2) try values aroun or slightly less those on loaded system. That way improved performance could be achieved. Especially if that slowdown mostly caused by memory accesses indeed (including page faults, cache misses, bus saturation and so on). I had no opportunity to check Intel's engeeneer suggestions regarding his theory (he thinks such slowdown cause by power limitation and leads to CPU freq lowering when GPU is active, look intel forum thread for details). Maybe worth to accurately check that too. ID: 1669494 · |
Richard Haselgrove  Send message Joined: 4 Jul 99 Posts: 14650 Credit: 200,643,578 RAC: 874 
|
OK, here's SETI OpenCL/Intel, running straight out of the box with 'below normal' priority. 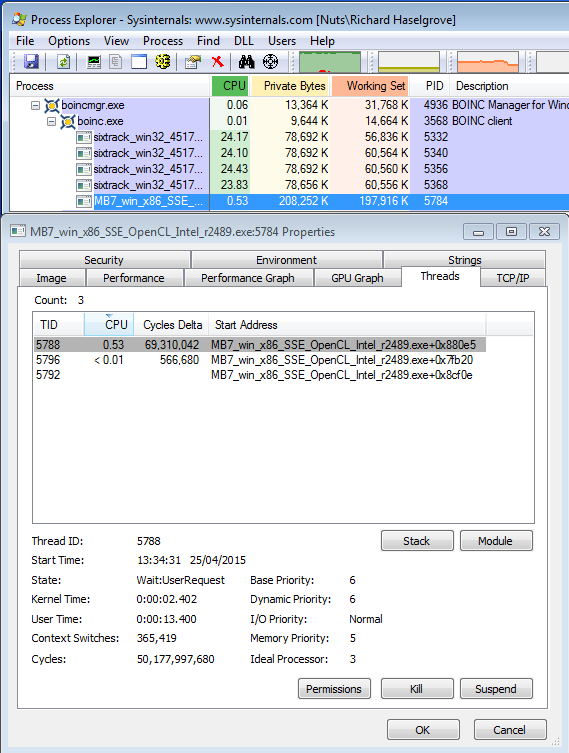 This app, with all four cores loaded, makes adequate progress with priority 6 for all threads - whereas the einstein app needs to be boosted right up to priority 16 (realtime) under the same conditions. Without that boost, its rate of progress drops 6x or 7x. ID: 1669754 · |
|
Raistmer Send message Joined: 16 Jun 01 Posts: 6325 Credit: 106,370,077 RAC: 121
|
Yep, but the real question was why einstein's app so suffer. To check that try to set MB priority to what you called "high" in old post (via ProcessLasso or other but same method you used for einstein's app). And post again Threads tab. ID: 1669756 · |
|
Richard Haselgrove Send message Joined: 4 Jul 99 Posts: 14650 Credit: 200,643,578 RAC: 874
|
Next task at a similar stage in the proceedings, with Process Lasso locking it to 'High' priority. 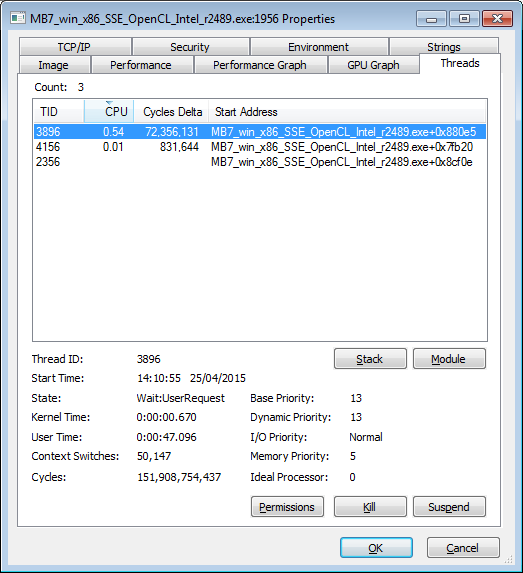 First task took 36:22 at 'below normal': will see how long this one takes (both shorties from the same tape). Edit - with the 'High' priority, it took 37:35 - slower. ID: 1669759 · |
|
Raistmer Send message Joined: 16 Jun 01 Posts: 6325 Credit: 106,370,077 RAC: 121
|
No need to wait longer. Just look how my app and how einstein's app reacted on priority change attempt (base priority field) It's illustration of what I said before: einstein's app missed to set right priority plan for process. Its priority can't be changed actually until RTP set (that overrides Windows priority policy). Thread priority IDLE should not be used if subsequent priority change is desirable. Use at least THREAD_PRIORITY_LOWEST thread priority. Reference: https://msdn.microsoft.com/ru-ru/library/windows/desktop/ms685100(v=vs.85).aspx EDIT: if(!SetThreadPriority(GetCurrentThread(),THREAD_PRIORITY_NORMAL)){
747 DWORD error=GetLastError();
748 LPSTR lpBuffer=NULL;
749 FormatMessage(FORMAT_MESSAGE_FROM_SYSTEM|FORMAT_MESSAGE_ALLOCATE_BUFFER,NULL,error,0,lpBuffer,0,NULL);
750
751 fprintf(stderr,"ERROR:can't set priority: %s\n",lpBuffer);
752 }else{
753 fprintf(stderr,"Priority of worker thread raised successfully\n");
754 }
755 if(high_priority){
756 if(!SetPriorityClass(GetCurrentProcess(),HIGH_PRIORITY_CLASS)){
757 fprintf(stderr,"ERROR:can't set process priority\n");
758 }else{
759 fprintf(stderr,"Priority of process adjusted successfully, high priority class used\n");
760 }
761 }else if(rtp){
762 if(!SetPriorityClass(GetCurrentProcess(),REALTIME_PRIORITY_CLASS)){
763 fprintf(stderr,"ERROR:can't set REALTIME_PRIORITY_CLASS process priority\n");
764 }else{
765 fprintf(stderr,"Priority of process adjusted successfully, real-time priority class used\n");
766 }
767 }else{
768 if(!SetPriorityClass(GetCurrentProcess(),BELOW_NORMAL_PRIORITY_CLASS)){
769 fprintf(stderr,"ERROR:can't set process priority\n");
770 }else{
771 fprintf(stderr,"Priority of process adjusted successfully, below normal priority class used\n");
772 }
773 }That's how priority change arranged in both MB and AP apps. This allows additional priority change if needed by external tools too. ID: 1669761 · |
|
Richard Haselgrove Send message Joined: 4 Jul 99 Posts: 14650 Credit: 200,643,578 RAC: 874
|
No need to wait longer. Are you going to tell Einstein, or do you want me to point them to your post? ID: 1669770 · |
|
Raistmer Send message Joined: 16 Jun 01 Posts: 6325 Credit: 106,370,077 RAC: 121
|
I'm lazy, you know ;) Back to own rams as we speak... ID: 1669784 · |

©2024 University of California
SETI@home and Astropulse are funded by grants from the National Science Foundation, NASA, and donations from SETI@home volunteers. AstroPulse is funded in part by the NSF through grant AST-0307956.