Loading APU to the limit: performance considerations - ongoing research
Message boards :
Number crunching :
Loading APU to the limit: performance considerations - ongoing research
Message board moderation
| Author | Message |
|---|---|
 Raistmer Raistmer Send message Joined: 16 Jun 01 Posts: 6325 Credit: 106,370,077 RAC: 121 
|
As followup to discussions of how multi-instance load affects host performance (simply saying, to answer the question "worth or not load APU to the max or reserve some cores/switch off GPU part instead ?") I resurrected old data + will collect new ones to create more or less comprehensive picture of load influence on some modern combined devices like AMD's APU Trinity and Intel's Ivy Bridge. Main article will reside on Lunatics board thanks its ability to permanent post edition and cool coloring scheme ;) . For non-Lunatics members this thread can serve as additional discussion place. Currently work in progress so welcome: http://lunatics.kwsn.net/1-discussion-forum/loading-apu-to-the-limit-performance-considerations.msg58456.html#msg58456 Happy Cosmonautics day! / С Днём КоÑмонавтики! ID: 1664472 · |
Richard Haselgrove  Send message Joined: 4 Jul 99 Posts: 14650 Credit: 200,643,578 RAC: 874 
|
I hope you will make this into a general research project, considering applications other than the two SETI searches. For example, two pertinent findings from Einstein: 1) (specifically for the Haswell, and perhaps later, variants) - newer driver versions significantly reduce runtime, but produce inaccurate (invalid) results 2) Again, only tested personally on Haswell, but I think generally applicable - iGPU throughput is greatly reduced if all CPU cores are fully loaded, but can be restored, without degrading general system usability, by running their iGPU application at realtime priority. In other words, there are many as-yet not fully understood variables in play, and it would be great if this initiative helped to tease them apart and explain them. ID: 1664475 · |
|
Raistmer Send message Joined: 16 Jun 01 Posts: 6325 Credit: 106,370,077 RAC: 121
|
From 2 mentioned params this study will cover mostly second one, specifically focusing on load influence. Performance dependence from used drivers is separate little touched field. But cause I need to bind data collected in different time periods other factors will reflected indirectly too to some extent. Of course, only configs able to return valid results worth consideration. Regarding realtime priority - did you checked if just high priority would enough? Realtime one can't be set on user level rights AFAIK. My builds support additional priority increase but being launched under user account realtime switch silently works as high one. So would be good to have exact priority numbers of app's computational thread that heals slowdown for Einstein's app. ID: 1664487 · |
|
Richard Haselgrove Send message Joined: 4 Jul 99 Posts: 14650 Credit: 200,643,578 RAC: 874
|
Interesting questions - even more so than I expected. Yes, I'm using realtime priority, maintained by Process Lasso. The worker thread looks like this: 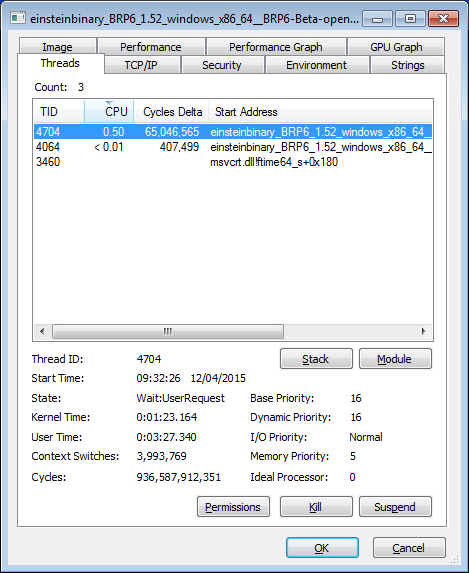 Dropping it to simple 'high' priority makes a huge difference: 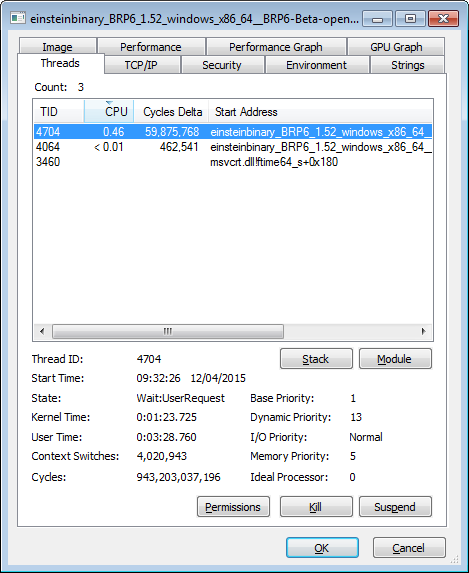 The other two threads both have priority 24/24 in realtime, and 13/13 in high. Process Lasso has "Windows dynamic thread priority boosts enabled". These screenshots were taken about four hours into an eight hour task, so three minutes of user time is neither here nor there. ID: 1664496 · |
|
Raistmer Send message Joined: 16 Jun 01 Posts: 6325 Credit: 106,370,077 RAC: 121
|
Base priority of 1 in second screenshot looks like no real boost applied. The behavior of dynamic boost complex enough to account for 16 vs 13 difference but base priority drop from 16 to just 1 explains difference quite well. And I have simple explanation already: most probably they apply priority change (if any) to thread priority instead of class priority. And with base class priority of IDLE no further increase with process priority will matter. That could explain 1 in secondary screenshot. Try to apply same changes to SETI OpenCL app where this effect accounted for. Will you see different numbers? ID: 1664500 · |
Cruncher-American  Send message Joined: 25 Mar 02 Posts: 1513 Credit: 370,893,186 RAC: 340 
|
Generic question: I have a Haswell (I7-4770K) and 2 x GTX780 in one machine. Due to temperature considerations, I have HT disabled. I have BOINC using 3 of the cores. I do not use the onboard GPU. Is it worth doing so? I would think not, given that the 780s are vastly "stronger" for GPU work, and the disparity in capability would cause problems, I would think. (I'm running 3 WUs at a time on each external GPU, for example). Also, if I am not using it, is there a way to turn it off, to not use any CPU cycles at all? ID: 1664504 · |
|
Raistmer Send message Joined: 16 Jun 01 Posts: 6325 Credit: 106,370,077 RAC: 121
|
I suppose answer will strongly depend from relative performance of CPU and GPU parts for your particular model. So far I saw slowdown for AP kind of load on my entry-level HD2500 that has GPU slower than single CPU core. On higher models situation could change. To turn off iGPU best to disable it in BIOS. That way Windows will not load corresponding driver perhaps. From other side you could use iGPU as display driver to save your fast NV GPUs from this work. Hard to predict how it will affect overall system throughput, experimentation required. ID: 1664508 · |
|
Richard Haselgrove Send message Joined: 4 Jul 99 Posts: 14650 Credit: 200,643,578 RAC: 874
|
It probably also depends on the nature of the load on the CPU. I tend to run 'lightweight' (integer only, or at least not using tightly-optimised floating point code) projects on CPUs, and they don't seem to be much affected. If you want to run optimised AVX code, I suspect that the combined power draw of CPU and iGPU might hit a thermal/TDP throttling point sooner. ID: 1664525 · |
|
Cruncher-American Send message Joined: 25 Mar 02 Posts: 1513 Credit: 370,893,186 RAC: 340
|
It probably also depends on the nature of the load on the CPU. I tend to run 'lightweight' (integer only, or at least not using tightly-optimised floating point code) projects on CPUs, and they don't seem to be much affected. If you want to run optimised AVX code, I suspect that the combined power draw of CPU and iGPU might hit a thermal/TDP throttling point sooner. Well, all I am running now is SETI, and it uses the AVX instructions, I believe. (I looked at my electric bill and decided that is it - SETI only). So I guess next time I take my machine down I will disable iGPU in BIOS. (Hopefully not soon - let's keep SETI running for awhile, shall we?). ID: 1664538 · |
|
HAL9000 Send message Joined: 11 Sep 99 Posts: 6534 Credit: 196,805,888 RAC: 57
|
On my two Haswell systems 5837483 & 7421701. So far the only time I see an significant reduction in CPU processing is when the iGPU is used for processing. Even if I have desktop extended so that BOINC detects the iGPU CPU I ATI GPU run times are not greatly effected. Also extending the desktop, or connecting a monitor to the iGPU, is required for clinfo to display iGPU information on my Haswell systems. Besides SETI@home & Einstein@Home are there many other projects that have iGPU applications? Perhaps running other apps could be helpful in some diagnostic or system analysis? I want to clarify. Running Einstein@Home iGPU app displays slowdown with all CPU cores running & a work around for that is to run iGPU in real-time. Doing so does not cause a significant CPU slowdown. I would not expect much slowdown for those that run their systems GPU only. Where the CPU is only being used to "feed" GPUs. SETI@home classic workunits: 93,865 CPU time: 863,447 hours  Join the [url=http://tinyurl.com/8y46zvu]BP6/VP6 User Group[ Join the [url=http://tinyurl.com/8y46zvu]BP6/VP6 User Group[
ID: 1664606 · |
|
Raistmer Send message Joined: 16 Jun 01 Posts: 6325 Credit: 106,370,077 RAC: 121
|
Better to check this on host with fast GPU of course, but I'm planning to check on my Ivy Bridge host that has also GSO9600 and GT9400 installed. ID: 1664640 · |
|
Sutaru Tsureku Send message Joined: 6 Apr 07 Posts: 7105 Credit: 147,663,825 RAC: 5 
|
HAL9000 wrote: (...) http://boinc.berkeley.edu/projects.php It looks like just Collatz Conjecture also have Intel iGPU apps (Mini- & Solo Collatz Conjecture): http://boinc.thesonntags.com/collatz/apps.php. 
ID: 1664701 · |
|
Raistmer Send message Joined: 16 Jun 01 Posts: 6325 Credit: 106,370,077 RAC: 121
|
Added some data for Trinity APU that illustrate the need in free core in AP-only configuration. http://lunatics.kwsn.net/1-discussion-forum/loading-apu-to-the-limit-performance-considerations.msg58473.html#msg58473 ID: 1665713 · |
|
HAL9000 Send message Joined: 11 Sep 99 Posts: 6534 Credit: 196,805,888 RAC: 57
|
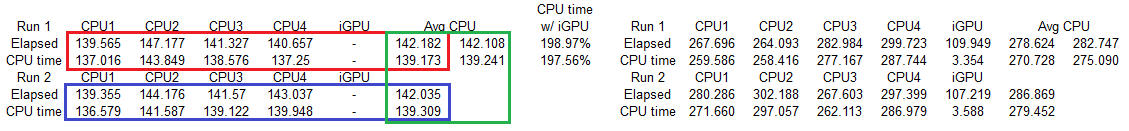
I have starting running test similar to yours. I couldn't find same versions of apps you listed, but used newest I had on hand. However I did use the same test file Clean_01LC.wu. I copied it to run twice for CPU test & copied it 6 times for iGPU to keep it busy while running CPU+iGPU tests. Results for my Haswell i5-4670K. Also results for my BayTrail Celeron J1900. Same test but only 3 copies for iGPU to run. I am still working on finishing all of the results for the J1900, but have completed 4CPU & 4CPU+iGPU. I will update results as tests finish. SETI@home classic workunits: 93,865 CPU time: 863,447 hours Join the [url=http://tinyurl.com/8y46zvu]BP6/VP6 User Group[
ID: 1666189 · |
|
Raistmer Send message Joined: 16 Jun 01 Posts: 6325 Credit: 106,370,077 RAC: 121
|
1. I used at least 3 Clean01 tasks per bench and took only middle one as reliable data to be sure that: 1) all devices warmed up 2) all devices constantly loaded through whole test task run. Using only 2 for CPU means last one can finish after iGPU already stopped. And initial warm-up included in timings for first one. 2. Why 3 pairs of mean CPU times? 2 pairs for 2 runs, but what 2 results in row mean? Did you averages separately between 0&1 and 2&3 cores? 3. Seems Haswell shows same tendency as my Ivy Bridge. Would be good to compute overall throughput for each config to see where extreme is. 4. Difference for Bail Trail very good shown. Enabling iGPU part almost has no effect on CPU subsystem performance. It's a big difference from all other APUs so far. Though iGPU performance only ~1 core in this case. What regarding cache subsystems ? Sizes? Levels? ID: 1666332 · |
|
HAL9000 Send message Joined: 11 Sep 99 Posts: 6534 Credit: 196,805,888 RAC: 57
|
1. I didn't realize you were always running 3. I saw after wisdom file as created test runs were very similar every time. Running two seemed like a good minimum number to run to tell if there were any odd results while running. At work when we do performance test we perform a minimum of 10 runs. Toss out top 2, toss out lower 2, & then use middle 6 for average. In the case of my test HD4600 iGPU is actually faster than 1 core of CPU. So I had to run more on iGPU to keep iGPU busy while CPU was running test. This gives me data for HS4600 iGPU from Clean_01LC-0.wu to Clean_01LC-5.wu. For most test the numbers for iGPU are very similar, but I only included Clean_01LC-0.wu & Clean_01LC-1.wu. For tests of 3, 2, & 1 CPU core iGPU is running alone after CPU finishes for last few instances. I have all output.txt files created from APBench tool I can upload as well if useful. Run 1 = Clean_01LC-0.wu & Run 2 = Clean_01LC-1.wu. Averages are for each row in a run. So CPU 1, 2, 3, & 4 together. The 3rd is the average of those two averages. So I know average of Run 1, average of Run 2, & then final average of whole test. http://hal6000.com/seti/test/apbench_result_exp.png Then "CPU time w/ iGPU" is final average with iGPU & without. At the time it made sense to me. Had I thought to upload the excel file, or used better labels, that probably would have cleared any confusion. I wasn't 100% sure if Ivy Bridge was effected the same. Based on Richards information about iGPU being slower instead of CPU on another project. When I noticed this behavior previously. I think I only did 1 or 2 quick test on the i5-3470 I have at work. Also I was just running task in BOINC & observing times instead of running bench test then. I am at work so I found CPUz info for cache of each CPU online Haswell i5-4670K & BayTrail Celeron J1900. Shows rather different cache setup for each. SETI@home classic workunits: 93,865 CPU time: 863,447 hours Join the [url=http://tinyurl.com/8y46zvu]BP6/VP6 User Group[
ID: 1666344 · |
|
Raistmer Send message Joined: 16 Jun 01 Posts: 6325 Credit: 106,370,077 RAC: 121
|
Hm... caches quite different indeed but exactly in opposite direction one could expect if cache thrashing would be main reason of big Haswell slowdown versus BayTrail. Seems Haswell has bigger cache amount, not smaller... ID: 1666431 · |
|
HAL9000 Send message Joined: 11 Sep 99 Posts: 6534 Credit: 196,805,888 RAC: 57
|
Hm... caches quite different indeed but exactly in opposite direction one could expect if cache thrashing would be main reason of big Haswell slowdown versus BayTrail. Seems Haswell has bigger cache amount, not smaller... BayTrail uses 1MB cache for each 2 core. So kind of 512k L2 per core vs 256k per core for Ivy Bridge & Haswell. Could smaller L2 or maybe added layer of L3 cache be related. Does each layer of cache add latency? That might be down to how the logic inside the chip works. idk. SETI@home classic workunits: 93,865 CPU time: 863,447 hours Join the [url=http://tinyurl.com/8y46zvu]BP6/VP6 User Group[
ID: 1666434 · |
|
jason_gee Send message Joined: 24 Nov 06 Posts: 7489 Credit: 91,093,184 RAC: 0 
|
...Could smaller L2 or maybe added layer of L3 cache be related. Does each layer of cache add latency? Yes it does. general rule of thumb is that if a L1 miss is 1 unit (latency) cost, then a L2 miss is 10 units, and a L3 miss (soft page fault) 100 units. A Hard page fault out to disk should be considered as 1000+ (out to infinite for estimation/optimisation purposes) The usual 'tricks' to make sure data is there before you need it, are architecture specific, though there are more rules of thumb with respect to keeping given dataset sizes hot' at á given cache level, software prefetch, and triggering available hardware prefetch mechanisms by touching data ahead of time in certain patterns. "Living by the wisdom of computer science doesn't sound so bad after all. And unlike most advice, it's backed up by proofs." -- Algorithms to live by: The computer science of human decisions. ID: 1666438 · |
|
Raistmer Send message Joined: 16 Jun 01 Posts: 6325 Credit: 106,370,077 RAC: 121
|
yep, each level definitely adds latency. But I expect that L3 still much faster than memory. Would be interesting to compare speed of caches between those architectures... But we look for dependency from number of instances, not absolute performance per se. And it should be easely still to fit completely into 6MB L3 than in 2MB L2. So, saturation of memory bus could be expected to start with bigger number of instances for Haswell. Apparently, some another factor in play, cache not deciding one it seems. ID: 1666440 · |

©2024 University of California
SETI@home and Astropulse are funded by grants from the National Science Foundation, NASA, and donations from SETI@home volunteers. AstroPulse is funded in part by the NSF through grant AST-0307956.