CPU usage while GPU crunching
Message boards :
Number crunching :
CPU usage while GPU crunching
Message board moderation
| Author | Message |
|---|---|
 SongBird SongBird Send message Joined: 23 Oct 01 Posts: 104 Credit: 164,826,157 RAC: 297 
|
Hi, I just bought a GTX 650 TI boost video card and decided to start crunching. I installed Lunatics selecting CUDA50 (Kepler). Edited the app_info.xml file to crunch 3 units at the same time. However task manager shows heavy CPU usage(third column is the CPU load in percent) which I do not accept as normal. The CPU is an old dual core Athlon 3800+. Can you help me figuring out what's wrong with my setup? Thanks! 
ID: 1456605 · |
|
SongBird Send message Joined: 23 Oct 01 Posts: 104 Credit: 164,826,157 RAC: 297
|
I just noticed something else. The lunatics app I'm using is CUDA50 but BOINC reports tasks as CUDA32. I don't know if that's relevant, but... Here is the screenshot.
ID: 1456639 · |
|
Fred E. Send message Joined: 22 Jul 99 Posts: 768 Credit: 24,140,697 RAC: 0 
|
Your computer is hidden so it is difficult for anyone to analyze. Set your Seti@Home preference to: Should SETI@home show your computers on its web site? yes Another Fred Support SETI@home when you search the Web with GoodSearch or shop online with GoodShop. 
ID: 1456650 · |
|
SongBird Send message Joined: 23 Oct 01 Posts: 104 Credit: 164,826,157 RAC: 297
|
Your computer is hidden so it is difficult for anyone to analyze. Set your Seti@Home preference to: Yes, sorry about that, i have a bunch of work computers in there and I do not feel comfortable making them public. Here is the machine in question (my personal). Notice that it has not yet updated the videocard and shows GTS250 rather than GTX 650TI Boost. Domain name Georgi-PC Local Standard Time UTC +2 hours Created 16 Feb 2011, 23:19:00 UTC Total credit 553,281 Average credit 1,061.53 Cross project credit BOINCstats.com Free-DC CPU type AuthenticAMD AMD Athlon(tm) 64 X2 Dual Core Processor 3800+ [Family 15 Model 43 Stepping 1] Number of processors 2 Coprocessors NVIDIA GeForce GTS 250 (1024MB) driver: 327.23 OpenCL: 1.00 Operating System Microsoft Windows 7 Ultimate x64 Edition, Service Pack 1, (06.01.7601.00) BOINC version 7.2.33 Memory 3071.55 MB Cache 512 KB Swap space 6141.3 MB Total disk space 30.15 GB Free Disk Space 0.95 GB Measured floating point speed 1789.04 million ops/sec Measured integer speed 4241.74 million ops/sec Average upload rate 10.12 KB/sec Average download rate 361.81 KB/sec Average turnaround time 5.67 days Application details Show Tasks 85 Number of times client has contacted server 700 Last time contacted server 23 Dec 2013, 8:06:00 UTC % of time BOINC is running 37.9452 % While BOINC running, % of time host has an Internet connection 99.9355 % While BOINC running, % of time work is allowed 99.8639 % Task duration correction factor 1
ID: 1456654 · |
|
Fred E. Send message Joined: 22 Jul 99 Posts: 768 Credit: 24,140,697 RAC: 0
|
Last time contacted server 23 Dec 2013, 8:06:00 UTC If you installed that gpu after that last contact, it will be repored on the next update. Look at the event log and see what it says on startup. If you instaled cuda 50 but had some cuda 32 tasks on hand, it is just getting rid of those and new work will be labeled cuda 50. Look at the stderr reports on your task page, or post a link to it so we can verify and look at the cpu times. Another Fred Support SETI@home when you search the Web with GoodSearch or shop online with GoodShop.
ID: 1456666 · |
|
SongBird Send message Joined: 23 Oct 01 Posts: 104 Credit: 164,826,157 RAC: 297
|
I updated. Got to update the computer info and downloaded new tasks which are indeed marked cuda50. Here is one random task information. Name 03dc13aa.10651.16836.438086664197.12.69_1 Workunit 1383196117 Created 20 Dec 2013, 20:00:19 UTC Sent 21 Dec 2013, 1:43:00 UTC Received 23 Dec 2013, 16:05:50 UTC Server state Over Outcome Success Client state Done Exit status 0 (0x0) Computer ID 5817412 Report deadline 2 Feb 2014, 5:42:19 UTC Run time 1,375.87 CPU time 400.75 Validate state Initial Credit 0.00 Application version SETI@home v7 Anonymous platform (NVIDIA GPU) Stderr output <core_client_version>7.2.33</core_client_version> <![CDATA[ <stderr_txt> setiathome_CUDA: Found 1 CUDA device(s): Device 1: GeForce GTX 650 Ti BOOST, 2048 MiB, regsPerBlock 65536 computeCap 3.0, multiProcs 4 pciBusID = 1, pciSlotID = 0 In cudaAcc_initializeDevice(): Boinc passed DevPref 1 setiathome_CUDA: CUDA Device 1 specified, checking... Device 1: GeForce GTX 650 Ti BOOST is okay SETI@home using CUDA accelerated device GeForce GTX 650 Ti BOOST pulsefind: blocks per SM 4 (Fermi or newer default) pulsefind: periods per launch 100 (default) Priority of process set to BELOW_NORMAL (default) successfully Priority of worker thread set successfully setiathome enhanced x41zc, Cuda 5.00 Detected setiathome_enhanced_v7 task. Autocorrelations enabled, size 128k elements. Work Unit Info: ............... WU true angle range is : 0.863787 Kepler GPU current clockRate = 1136 MHz re-using dev_GaussFitResults array for dev_AutoCorrIn, 4194304 bytes re-using dev_GaussFitResults+524288x8 array for dev_AutoCorrOut, 4194304 bytes Thread call stack limit is: 1k Exit Status: 0 boinc_exit(): requesting safe worker shutdown -> Worker Acknowledging exit request, spinning-> boinc_exit(): received safe worker shutdown acknowledge -> Cuda threadsafe ExitProcess() initiated, rval 0 setiathome_CUDA: Found 1 CUDA device(s): Device 1: GeForce GTX 650 Ti BOOST, 2048 MiB, regsPerBlock 65536 computeCap 3.0, multiProcs 4 pciBusID = 1, pciSlotID = 0 In cudaAcc_initializeDevice(): Boinc passed DevPref 1 setiathome_CUDA: CUDA Device 1 specified, checking... Device 1: GeForce GTX 650 Ti BOOST is okay SETI@home using CUDA accelerated device GeForce GTX 650 Ti BOOST pulsefind: blocks per SM 4 (Fermi or newer default) pulsefind: periods per launch 100 (default) Priority of process set to BELOW_NORMAL (default) successfully Priority of worker thread set successfully Restarted at 21.90 percent, with Lunatics x41zc, Cuda 5.00 Detected setiathome_enhanced_v7 task. Autocorrelations enabled, size 128k elements. Kepler GPU current clockRate = 1136 MHz re-using dev_GaussFitResults array for dev_AutoCorrIn, 4194304 bytes re-using dev_GaussFitResults+524288x8 array for dev_AutoCorrOut, 4194304 bytes Thread call stack limit is: 1k setiathome_CUDA: Found 1 CUDA device(s): Device 1: GeForce GTX 650 Ti BOOST, 2048 MiB, regsPerBlock 65536 computeCap 3.0, multiProcs 4 pciBusID = 1, pciSlotID = 0 In cudaAcc_initializeDevice(): Boinc passed DevPref 1 setiathome_CUDA: CUDA Device 1 specified, checking... Device 1: GeForce GTX 650 Ti BOOST is okay SETI@home using CUDA accelerated device GeForce GTX 650 Ti BOOST pulsefind: blocks per SM 4 (Fermi or newer default) pulsefind: periods per launch 100 (default) Priority of process set to BELOW_NORMAL (default) successfully Priority of worker thread set successfully Restarted at 33.17 percent, with Lunatics x41zc, Cuda 5.00 Detected setiathome_enhanced_v7 task. Autocorrelations enabled, size 128k elements. Kepler GPU current clockRate = 1110 MHz re-using dev_GaussFitResults array for dev_AutoCorrIn, 4194304 bytes re-using dev_GaussFitResults+524288x8 array for dev_AutoCorrOut, 4194304 bytes Thread call stack limit is: 1k Exit Status: 0 boinc_exit(): requesting safe worker shutdown -> Worker Acknowledging exit request, spinning-> boinc_exit(): received safe worker shutdown acknowledge -> Cuda threadsafe ExitProcess() initiated, rval 0 setiathome_CUDA: Found 1 CUDA device(s): Device 1: GeForce GTX 650 Ti BOOST, 2048 MiB, regsPerBlock 65536 computeCap 3.0, multiProcs 4 pciBusID = 1, pciSlotID = 0 In cudaAcc_initializeDevice(): Boinc passed DevPref 1 setiathome_CUDA: CUDA Device 1 specified, checking... Device 1: GeForce GTX 650 Ti BOOST is okay SETI@home using CUDA accelerated device GeForce GTX 650 Ti BOOST pulsefind: blocks per SM 4 (Fermi or newer default) pulsefind: periods per launch 100 (default) Priority of process set to BELOW_NORMAL (default) successfully Priority of worker thread set successfully Restarted at 33.17 percent, with Lunatics x41zc, Cuda 5.00 Detected setiathome_enhanced_v7 task. Autocorrelations enabled, size 128k elements. Kepler GPU current clockRate = 1136 MHz re-using dev_GaussFitResults array for dev_AutoCorrIn, 4194304 bytes re-using dev_GaussFitResults+524288x8 array for dev_AutoCorrOut, 4194304 bytes Thread call stack limit is: 1k Exit Status: 0 boinc_exit(): requesting safe worker shutdown -> Worker Acknowledging exit request, spinning-> boinc_exit(): received safe worker shutdown acknowledge -> Cuda threadsafe ExitProcess() initiated, rval 0 setiathome_CUDA: Found 1 CUDA device(s): Device 1: GeForce GTX 650 Ti BOOST, 2048 MiB, regsPerBlock 65536 computeCap 3.0, multiProcs 4 pciBusID = 1, pciSlotID = 0 In cudaAcc_initializeDevice(): Boinc passed DevPref 1 setiathome_CUDA: CUDA Device 1 specified, checking... Device 1: GeForce GTX 650 Ti BOOST is okay SETI@home using CUDA accelerated device GeForce GTX 650 Ti BOOST pulsefind: blocks per SM 4 (Fermi or newer default) pulsefind: periods per launch 100 (default) Priority of process set to BELOW_NORMAL (default) successfully Priority of worker thread set successfully Restarted at 37.11 percent, with Lunatics x41zc, Cuda 5.00 Detected setiathome_enhanced_v7 task. Autocorrelations enabled, size 128k elements. Kepler GPU current clockRate = 1136 MHz re-using dev_GaussFitResults array for dev_AutoCorrIn, 4194304 bytes re-using dev_GaussFitResults+524288x8 array for dev_AutoCorrOut, 4194304 bytes Thread call stack limit is: 1k cudaAcc_free() called... cudaAcc_free() running... cudaAcc_free() PulseFind freed... cudaAcc_free() Gaussfit freed... cudaAcc_free() AutoCorrelation freed... cudaAcc_free() DONE. Flopcounter: 24742063038781.184000 Spike count: 0 Autocorr count: 10 Pulse count: 0 Triplet count: 1 Gaussian count: 0 Worker preemptively acknowledging a normal exit.-> called boinc_finish Exit Status: 0 boinc_exit(): requesting safe worker shutdown -> boinc_exit(): received safe worker shutdown acknowledge -> Cuda threadsafe ExitProcess() initiated, rval 0 </stderr_txt> ]]>
ID: 1456678 · |
|
SongBird Send message Joined: 23 Oct 01 Posts: 104 Credit: 164,826,157 RAC: 297
|
I updated. Got to update the computer info and downloaded new tasks which are indeed marked cuda50. Here is one random task information. Name 03dc13aa.10651.16836.438086664197.12.69_1 Workunit 1383196117 Created 20 Dec 2013, 20:00:19 UTC Sent 21 Dec 2013, 1:43:00 UTC Received 23 Dec 2013, 16:05:50 UTC Server state Over Outcome Success Client state Done Exit status 0 (0x0) Computer ID 5817412 Report deadline 2 Feb 2014, 5:42:19 UTC Run time 1,375.87 CPU time 400.75 Validate state Initial Credit 0.00 Application version SETI@home v7 Anonymous platform (NVIDIA GPU) Stderr output <core_client_version>7.2.33</core_client_version> <![CDATA[ <stderr_txt> setiathome_CUDA: Found 1 CUDA device(s): Device 1: GeForce GTX 650 Ti BOOST, 2048 MiB, regsPerBlock 65536 computeCap 3.0, multiProcs 4 pciBusID = 1, pciSlotID = 0 In cudaAcc_initializeDevice(): Boinc passed DevPref 1 setiathome_CUDA: CUDA Device 1 specified, checking... Device 1: GeForce GTX 650 Ti BOOST is okay SETI@home using CUDA accelerated device GeForce GTX 650 Ti BOOST pulsefind: blocks per SM 4 (Fermi or newer default) pulsefind: periods per launch 100 (default) Priority of process set to BELOW_NORMAL (default) successfully Priority of worker thread set successfully setiathome enhanced x41zc, Cuda 5.00 Detected setiathome_enhanced_v7 task. Autocorrelations enabled, size 128k elements. Work Unit Info: ............... WU true angle range is : 0.863787 Kepler GPU current clockRate = 1136 MHz re-using dev_GaussFitResults array for dev_AutoCorrIn, 4194304 bytes re-using dev_GaussFitResults+524288x8 array for dev_AutoCorrOut, 4194304 bytes Thread call stack limit is: 1k Exit Status: 0 boinc_exit(): requesting safe worker shutdown -> Worker Acknowledging exit request, spinning-> boinc_exit(): received safe worker shutdown acknowledge -> Cuda threadsafe ExitProcess() initiated, rval 0 setiathome_CUDA: Found 1 CUDA device(s): Device 1: GeForce GTX 650 Ti BOOST, 2048 MiB, regsPerBlock 65536 computeCap 3.0, multiProcs 4 pciBusID = 1, pciSlotID = 0 In cudaAcc_initializeDevice(): Boinc passed DevPref 1 setiathome_CUDA: CUDA Device 1 specified, checking... Device 1: GeForce GTX 650 Ti BOOST is okay SETI@home using CUDA accelerated device GeForce GTX 650 Ti BOOST pulsefind: blocks per SM 4 (Fermi or newer default) pulsefind: periods per launch 100 (default) Priority of process set to BELOW_NORMAL (default) successfully Priority of worker thread set successfully Restarted at 21.90 percent, with Lunatics x41zc, Cuda 5.00 Detected setiathome_enhanced_v7 task. Autocorrelations enabled, size 128k elements. Kepler GPU current clockRate = 1136 MHz re-using dev_GaussFitResults array for dev_AutoCorrIn, 4194304 bytes re-using dev_GaussFitResults+524288x8 array for dev_AutoCorrOut, 4194304 bytes Thread call stack limit is: 1k setiathome_CUDA: Found 1 CUDA device(s): Device 1: GeForce GTX 650 Ti BOOST, 2048 MiB, regsPerBlock 65536 computeCap 3.0, multiProcs 4 pciBusID = 1, pciSlotID = 0 In cudaAcc_initializeDevice(): Boinc passed DevPref 1 setiathome_CUDA: CUDA Device 1 specified, checking... Device 1: GeForce GTX 650 Ti BOOST is okay SETI@home using CUDA accelerated device GeForce GTX 650 Ti BOOST pulsefind: blocks per SM 4 (Fermi or newer default) pulsefind: periods per launch 100 (default) Priority of process set to BELOW_NORMAL (default) successfully Priority of worker thread set successfully Restarted at 33.17 percent, with Lunatics x41zc, Cuda 5.00 Detected setiathome_enhanced_v7 task. Autocorrelations enabled, size 128k elements. Kepler GPU current clockRate = 1110 MHz re-using dev_GaussFitResults array for dev_AutoCorrIn, 4194304 bytes re-using dev_GaussFitResults+524288x8 array for dev_AutoCorrOut, 4194304 bytes Thread call stack limit is: 1k Exit Status: 0 boinc_exit(): requesting safe worker shutdown -> Worker Acknowledging exit request, spinning-> boinc_exit(): received safe worker shutdown acknowledge -> Cuda threadsafe ExitProcess() initiated, rval 0 setiathome_CUDA: Found 1 CUDA device(s): Device 1: GeForce GTX 650 Ti BOOST, 2048 MiB, regsPerBlock 65536 computeCap 3.0, multiProcs 4 pciBusID = 1, pciSlotID = 0 In cudaAcc_initializeDevice(): Boinc passed DevPref 1 setiathome_CUDA: CUDA Device 1 specified, checking... Device 1: GeForce GTX 650 Ti BOOST is okay SETI@home using CUDA accelerated device GeForce GTX 650 Ti BOOST pulsefind: blocks per SM 4 (Fermi or newer default) pulsefind: periods per launch 100 (default) Priority of process set to BELOW_NORMAL (default) successfully Priority of worker thread set successfully Restarted at 33.17 percent, with Lunatics x41zc, Cuda 5.00 Detected setiathome_enhanced_v7 task. Autocorrelations enabled, size 128k elements. Kepler GPU current clockRate = 1136 MHz re-using dev_GaussFitResults array for dev_AutoCorrIn, 4194304 bytes re-using dev_GaussFitResults+524288x8 array for dev_AutoCorrOut, 4194304 bytes Thread call stack limit is: 1k Exit Status: 0 boinc_exit(): requesting safe worker shutdown -> Worker Acknowledging exit request, spinning-> boinc_exit(): received safe worker shutdown acknowledge -> Cuda threadsafe ExitProcess() initiated, rval 0 setiathome_CUDA: Found 1 CUDA device(s): Device 1: GeForce GTX 650 Ti BOOST, 2048 MiB, regsPerBlock 65536 computeCap 3.0, multiProcs 4 pciBusID = 1, pciSlotID = 0 In cudaAcc_initializeDevice(): Boinc passed DevPref 1 setiathome_CUDA: CUDA Device 1 specified, checking... Device 1: GeForce GTX 650 Ti BOOST is okay SETI@home using CUDA accelerated device GeForce GTX 650 Ti BOOST pulsefind: blocks per SM 4 (Fermi or newer default) pulsefind: periods per launch 100 (default) Priority of process set to BELOW_NORMAL (default) successfully Priority of worker thread set successfully Restarted at 37.11 percent, with Lunatics x41zc, Cuda 5.00 Detected setiathome_enhanced_v7 task. Autocorrelations enabled, size 128k elements. Kepler GPU current clockRate = 1136 MHz re-using dev_GaussFitResults array for dev_AutoCorrIn, 4194304 bytes re-using dev_GaussFitResults+524288x8 array for dev_AutoCorrOut, 4194304 bytes Thread call stack limit is: 1k cudaAcc_free() called... cudaAcc_free() running... cudaAcc_free() PulseFind freed... cudaAcc_free() Gaussfit freed... cudaAcc_free() AutoCorrelation freed... cudaAcc_free() DONE. Flopcounter: 24742063038781.184000 Spike count: 0 Autocorr count: 10 Pulse count: 0 Triplet count: 1 Gaussian count: 0 Worker preemptively acknowledging a normal exit.-> called boinc_finish Exit Status: 0 boinc_exit(): requesting safe worker shutdown -> boinc_exit(): received safe worker shutdown acknowledge -> Cuda threadsafe ExitProcess() initiated, rval 0 </stderr_txt> ]]>
ID: 1456681 · |
|
Fred E. Send message Joined: 22 Jul 99 Posts: 768 Credit: 24,140,697 RAC: 0
|
Not sure what's causing the high cpu time, maybe someone else will spot it. Here's two thoughts that may contribute to that high time: 1.) Three at a time is ambitious for that gpu with v7. My 670 works best at two at a time. Try that to see if it helps and wait to test 3 at a time until you get repeated good results. 3 may be okay for astropulse, you'll have to experiment. 2) Increase the priority of the gpu tasks from the default (below normal) to above normal by editing the mbcuda.cfg file. There is text in that file to help understand the syntax. The file is in your Seti@Home directory. I'd leave the other settings at default values until you have a track record with those settings. Another Fred Support SETI@home when you search the Web with GoodSearch or shop online with GoodShop.
ID: 1456689 · |
|
tbret Send message Joined: 28 May 99 Posts: 3380 Credit: 296,162,071 RAC: 40
|
It isn't your setup, it's the application. What you are seeing is a "new normal." The CPU is "busy" that amount of time, but as far as I can tell on my systems it isn't really doing anything for much of that time. (low heat / no machine lag) So the thing to avoid is making the CPU busy really doing something (like CPU work units) and denying it CPU time when the GPU really needs the CPU to do something. On that machine I'd crunch GPU only. That CPU is really bad at crunching anyway, so you won't miss much. There's a beta-version of the application that will reduce your CPU's "busy-ness" if you want to experiment. I see the same thing across all of my machines including my old Athlon 64 FX-5600+. ID: 1456733 · |
|
jason_gee Send message Joined: 24 Nov 06 Posts: 7489 Credit: 91,093,184 RAC: 0 
|
On the Cuda side there's some amount of truth to this pessimistic outlook, with two major (and very gradual) changes since April. First Microsoft's Display Driver model has been evolving to 'share' between applications 'nicer', some notable system framework portions being updated through Windows update. Not something dedicated crunchers might find desirable. Secondly, GPU side models also progress, and tend to be oriented toward including new features in software where the hardware doesn't have it (mostly to do with communications to the CPU and memory management) Along those lines, the current Cuda Multibeam's (x41zc's) approaches are already getting 'tired', so a fairly extensive re-engineering effort (x42) has started to minimise, absorb & hide the added latencies (i.e. reduce visible cost overhead). It's not likely to be a 'quick fix' for everything, but certainly should address the growing underlying costs, particularly with higher performance GPUs on older CPU Hosts. Jason "Living by the wisdom of computer science doesn't sound so bad after all. And unlike most advice, it's backed up by proofs." -- Algorithms to live by: The computer science of human decisions. ID: 1456969 · |
|
SongBird Send message Joined: 23 Oct 01 Posts: 104 Credit: 164,826,157 RAC: 297
|
Tried two units at the same time. Tried high priority. To no avail. And with the last two posts I will just accept it as normal and wait patiently for the next cuda app. What was broken by developers should be fixable by developers... Thank you all and happy holidays!
ID: 1457071 · |
|
Claggy Send message Joined: 5 Jul 99 Posts: 4654 Credit: 47,537,079 RAC: 4 
|
I updated. Got to update the computer info and downloaded new tasks which are indeed marked cuda50. For anyone's that's interested here's the affected host: Computer 5817412 Looking at it's completed tasks it's using ~300 secs of CPU time per MB Wu, in comparison on my i7-2600K/GTX460/HD7770 host it's ~80 secs, while on my i5-3210M/GT650M/HD4000 it's around 170 secs of CPU time per MB Wu. Looking at the host details page, it's Windows 7 x86 with 3071.55 Mb RAM, But with a 2048Mb GPU, I wonder how much usable memory it has now with that GTX 650 Ti BOOST taking 2048Mb of the addressable space, and how that effects performance. Claggy ID: 1457085 · |
|
jason_gee Send message Joined: 24 Nov 06 Posts: 7489 Credit: 91,093,184 RAC: 0
|
Ugh, given that half that remaining Gig will be Kernel space.... not a lot left. I recant my claim ongoing OS/dirver changes are responsible in this case, and instead suggest this GPU is rather OP for a 32 bit system (VRAM wise at least). "Living by the wisdom of computer science doesn't sound so bad after all. And unlike most advice, it's backed up by proofs." -- Algorithms to live by: The computer science of human decisions. ID: 1457104 · |
|
SongBird Send message Joined: 23 Oct 01 Posts: 104 Credit: 164,826,157 RAC: 297
|
I'm not sure where the 32 bit OS came from... My OS is a 64bit Windows 7. The 3 GB of RAM are low I'll admit :) [edit]The lunatics executable is 32 bit though which is strange because I used the 64 bit Lunatics installer. I just double checked in the control panel. [edit2]I didn't know computers are visible like that. Had I known I would have posted it from the beginning.
ID: 1457121 · |
|
jason_gee Send message Joined: 24 Nov 06 Posts: 7489 Credit: 91,093,184 RAC: 0
|
LoL, recant recanted. ... [edit]The lunatics executable is 32 bit though which is strange because I used the 64 bit Lunatics installer. I just double checked in the control panel. Correct. Cuda GPU applications, if compiled for 64 bit, incur from a few to ~10 percent performance penalty in the GPU side code, due to using 64 bit addressing. This makes the build redundant (32 bit Cuda is faster, so is what's distributed). "Living by the wisdom of computer science doesn't sound so bad after all. And unlike most advice, it's backed up by proofs." -- Algorithms to live by: The computer science of human decisions. ID: 1457129 · |
|
Claggy Send message Joined: 5 Jul 99 Posts: 4654 Credit: 47,537,079 RAC: 4
|
Sorry about that, I could have sworn I saw x86, I was a bit surprised Boinc was still reporting 3 Gig RAM through, Claggy ID: 1457131 · |
|
TBar Send message Joined: 22 May 99 Posts: 5204 Credit: 840,779,836 RAC: 2,768
|
Here are two very similar cards, one in 32 bit Windows XP the other in 32 bit Windows 8.1. They are both using the same version of x41zc on dual core Intels. XP has driver 266.58, 8.1 has 331.82. Both cards take longer to run and use more CPU in Windows 8.1. Windows XP Windows 8.1 ID: 1457134 · |
|
jason_gee Send message Joined: 24 Nov 06 Posts: 7489 Credit: 91,093,184 RAC: 0
|
Here are two very similar cards, one in 32 bit Windows XP the other in 32 bit Windows 8.1. They are both using the same version of x41zc on dual core Intels. XP has driver 266.58, 8.1 has 331.82. Both cards take longer to run and use more CPU in Windows 8.1. Yeah, that's the other angle on the same increasing (OS) latency costs. Fortunately it turns out all of them, XP-old-driver included, have substantial and growing latencies to be hidden in x42, so more of a reeningeering challenge than an OS specific issue (which would be harder to handle). "Living by the wisdom of computer science doesn't sound so bad after all. And unlike most advice, it's backed up by proofs." -- Algorithms to live by: The computer science of human decisions. ID: 1457135 · |
|
Claggy Send message Joined: 5 Jul 99 Posts: 4654 Credit: 47,537,079 RAC: 4
|
Here are two very similar cards, one in 32 bit Windows XP the other in 32 bit Windows 8.1. They are both using the same version of x41zc on dual core Intels. XP has driver 266.58, 8.1 has 331.82. Both cards take longer to run and use more CPU in Windows 8.1. My 9800GTX+ CPU times on Vista x64 are inbetween your times of your 8800 GT on XP, and your GTS 250 on Win 8.1: Windows Vista My 9800GTX+ is on PCI-E 1.1 x16, While my GTX460 is on PCI-E 2.0 x8, What PCI-E speeds are your GPUs on, and what is SongBird's host on? (During testing we discovered a slowdown because of the amount of data transferred by PCI-E, so the added CPU time could be related to that) Here are times for a PCI 8400GS on XP (the CPU times at least 4 times larger than TBar's XP host, but also the 8400GS is a lot slower taking ~25 times longer to do tasks): PCI 8400GS on XP Claggy ID: 1457137 · |
|
TBar Send message Joined: 22 May 99 Posts: 5204 Credit: 840,779,836 RAC: 2,768
|
Both cards are currently in PCIe 2.0 capable Motherboards in 16x slots. The 8.1 host is reduced to 8x due to having 2 cards in both 16x slots. Both cards were swapped within the week, if you look back you can see where the cards were in the different Hosts. When the 250 was in the XP Host, it was in a PCIe 1x slot and still gave better times than the 8800 does now in the 16x slot on the XP Host. 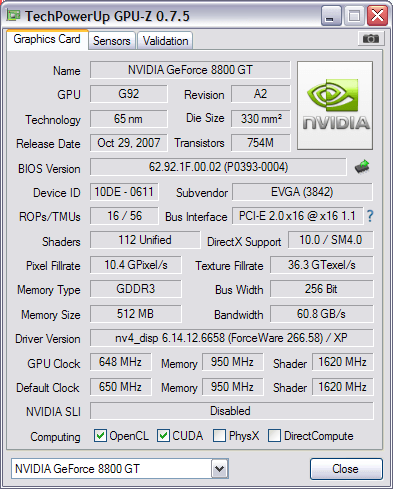 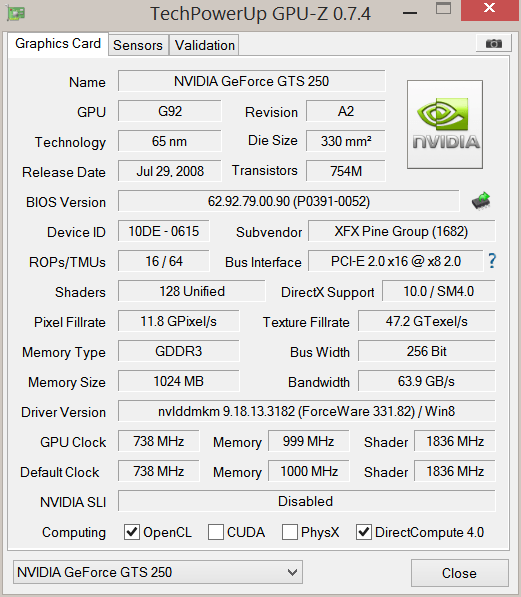 ID: 1457141 · |

©2024 University of California
SETI@home and Astropulse are funded by grants from the National Science Foundation, NASA, and donations from SETI@home volunteers. AstroPulse is funded in part by the NSF through grant AST-0307956.