What is your most interesting signal in MapView?
Message boards :
SETI@home Science :
What is your most interesting signal in MapView?
Message board moderation
| Author | Message |
|---|---|
 Ragnar Sandberg Ragnar Sandberg Send message Joined: 21 Apr 12 Posts: 10 Credit: 2,110,494 RAC: 1 
|
Hi there fellow SETI@home enthusiasts! I recently managed to get Björn Henke's MapView application to work alongside his BoincLogX application. I find this is a fun way to keep up my motivation for SETI@home, even if virtually all the signals eventually turn out to originate with planes or satellites. So what is YOUR most interesting signal as captured by Björn Henke's MapView? By interesting I mean the signal among the top 10 best signals in the software that you think somehow stands out. My own favorite signal overlaps probably by pure chance the direction of the star HD 145457. According to the German astrophysicist Hanno Rein's exoplanet app, there is one giant gas planet in the HD 145457 system with an orbital period of 176.30 days. The signal processed by SETI@home in all likelihood originated inside our very own Solar system, but I still find it fascinating that it seems to fit in the HD 145457 system so snugly. Here you have a screenshot of my most interesting signal to date: 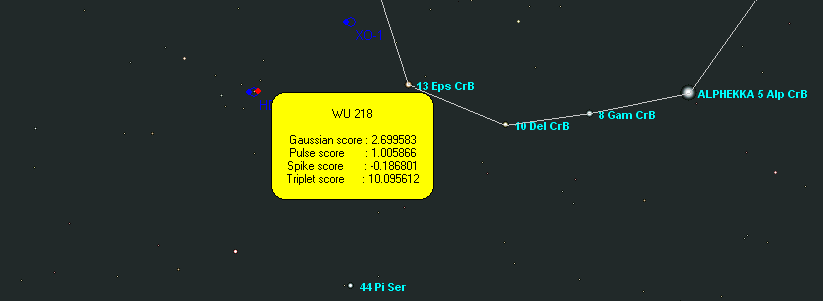 So, what is your favorite signal as illustrated by MapView? ID: 1350665 · |
|
Bob DeWoody Send message Joined: 9 May 10 Posts: 3387 Credit: 4,182,900 RAC: 10 
|
I have no idea whether my computer has encountered any interesting signals in the twelve years I have participated in the project. I just let it do it's thing and occasionally check to make sure it hasn't frozen up analyzing a packet of raw data. It's just not that interesting to watch doing it's work. Bob DeWoody My motto: Never do today what you can put off until tomorrow as it may not be required. This no longer applies in light of current events. ID: 1350773 · |
|
musicplayer Send message Joined: 17 May 10 Posts: 2430 Credit: 926,046 RAC: 0 |
Hi Ragnar! Do you think this result of yours is very good? Always make a guess about what is the best you may have. I happened to listen to the WOW signal as it is available on YouTube. Either the web-links being used were giving better than usual playback quality or the drivers for my sound card may have improved. But the spikes in the signal are quite audible, other sounds being heard may be information being broadcast by means of gaussians. Surely or certainly, gaussians are made up of spikes and/or pulses. Logically this signal should be consisting of pulses also, but to me the spikes which may be in this signal are more evident. So the question is then as follows - if you have the sound file, then it should be possible to digitize this sound and make a modern playback solution for this famous signal. But as far as I know, no-one has yet been doing so and I would like to know why. Also what was actually in this transmission and not only the sound of it should be the main point of interest. http://www.youtube.com/watch?v=T1E4kstjZWo&feature=endscreen&NR=1 ID: 1365003 · |
|
Mario Send message Joined: 20 Apr 13 Posts: 1 Credit: 10,460 RAC: 0
|
Wow I just wish I could find out how to do different views like the mapview you are talking about, It is slow to watch and I am new at this but enjoy it very much. Thanks for showing your graph. Mario ID: 1368043 · |

©2024 University of California
SETI@home and Astropulse are funded by grants from the National Science Foundation, NASA, and donations from SETI@home volunteers. AstroPulse is funded in part by the NSF through grant AST-0307956.