haven't seen a result like this before
Message boards :
SETI@home Science :
haven't seen a result like this before
Message board moderation
| Author | Message |
|---|---|
|
Maxwell Johnson Send message Joined: 4 Apr 02 Posts: 2 Credit: 755,925 RAC: 2 
|
Hey, I've seen a few results of this type recently; I don't think I've ever seen stuff like this before, and I'm curious as to what it might be. I'm not so self-absorbed as to believe that I've found something new or unique, but I am curious as to what this is, since it definitely looks different from what I normally see when looking at Seti@home. Anyone have anything to say about this? 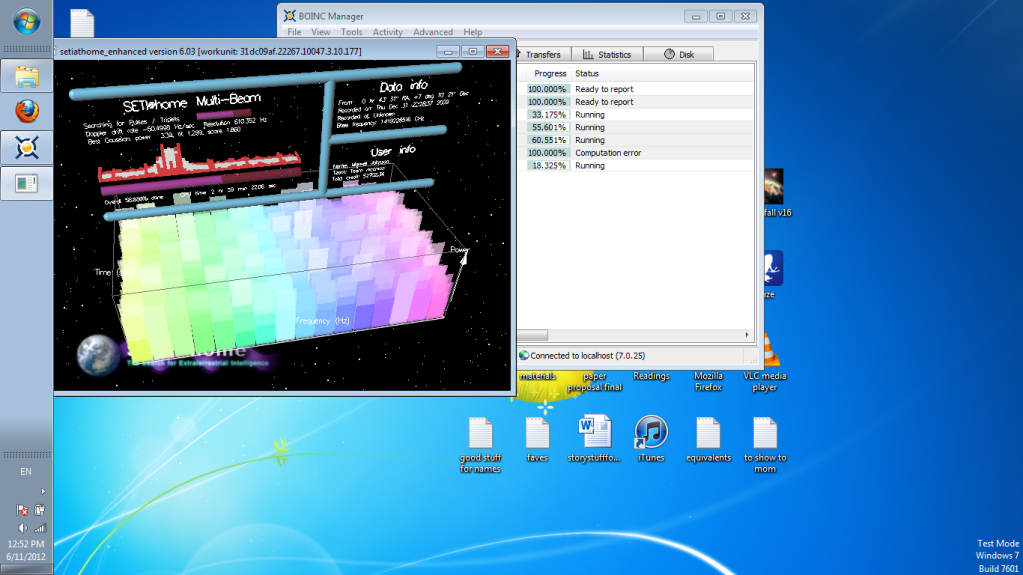 ID: 1250151 · |
 skildude skildude Send message Joined: 4 Oct 00 Posts: 9541 Credit: 50,759,529 RAC: 60 
|
are you speaking about the red area with the bell shape. this is your seti@home screensaver attempting to fill in a gaussian curve.  In a rich man's house there is no place to spit but his face. Diogenes Of Sinope ID: 1251094 · |
|
musicplayer Send message Joined: 17 May 10 Posts: 2430 Credit: 926,046 RAC: 0 |
I don't see anything special here either. No need for this one. There is a computational error for one of the other tasks in the Manager. Whether or not it is a Seti@home task or something else is difficult to tell. The score is 1.880 and power and fit are usual values (either 3.34 or 3.39 for power and 1.299 for fit). I guess the power, period and score for the corresponding pulse (if any) were having other numbers. Regardless of numbers, we should be looking for a possible transmission. The numbers we get in our results would give an indication of whether such a transmission was ever being carried out. ID: 1251106 · |
|
Maxwell Johnson Send message Joined: 4 Apr 02 Posts: 2 Credit: 755,925 RAC: 2
|
The red area with the bell shape and the numbers weren't what I was asking about. I should have been more specific in my question. Sorry about the misunderstanding. I was referring to the unusual 'wideness' (on the frequency axis) of the bars on the time/power/frequency graph. Normally, It seems to me. 1. They'd be a lot thinner 2. There'd be a lot more of them, 3. The relative difference in power between the highest and lowest results seems like it would normally be greater, too. At least, those are the differences I see compared to the stuff I normally see when looking at Seti@home. Whatever the source or explanation, it was different from the norm, so I thought I'd ask. By the way, The computational error was for Rosetta@home, I remember. So no relation to this. ID: 1251178 · |
|
skildude Send message Joined: 4 Oct 00 Posts: 9541 Credit: 50,759,529 RAC: 60
|
the thickness is due to the bandwidth which is being tested. The 107 seconds is tested again and again from what looks like thick wide bars to very thin rod like bits. What you have is not at all unusual In a rich man's house there is no place to spit but his face. Diogenes Of Sinope ID: 1251362 · |
|
Bob DeWoody Send message Joined: 9 May 10 Posts: 3387 Credit: 4,182,900 RAC: 10
|
I have seen the wide bars on my screen and just assumed it had to do with the particular block of data being analyzed. My computer used to be in my bedroom and I recall times that from a distance and through my half asleep eyes some sort of pattern would develope during the run of data, but if I got up to investigate further I could find nothing of any pattern. Bob DeWoody My motto: Never do today what you can put off until tomorrow as it may not be required. This no longer applies in light of current events. ID: 1251606 · |
|
Rodie Send message Joined: 8 Jun 12 Posts: 1 Credit: 26,019 RAC: 0
|
Sometimes pulses will cluster together and SETI tries to fit these pulse clusters into a Gaussian curve. What I've been noticing is the surprising number of closely matched triplets seen in WU's from November 2011 through February 2012. ID: 1251703 · |

©2024 University of California
SETI@home and Astropulse are funded by grants from the National Science Foundation, NASA, and donations from SETI@home volunteers. AstroPulse is funded in part by the NSF through grant AST-0307956.